Difference between revisions of "Orange: FreeViz"
Onnowpurbo (talk | contribs) |
Onnowpurbo (talk | contribs) |
||
| Line 2: | Line 2: | ||
| − | + | Widget FreeViz menayangkan FreeViz projection. | |
==Input== | ==Input== | ||
| Line 15: | Line 15: | ||
Components: FreeViz vectors | Components: FreeViz vectors | ||
| − | FreeViz | + | FreeViz menggunakan paradigma yang dipinjam dari particle physics: titik-titik dalam kelas yang sama akan menarik satu sama lain, sedangkan mereka yang berasal dari kelas yang berbeda akan saling tolak satu sama lain, dan gaya yang dihasilkan diberikan pada jangkar atribut, yaitu, pada vektor satuan dari masing-masing dimensional axis. Poin tidak dapat bergerak (diproyeksikan dalam ruang proyeksi), tetapi atribut anchor dapat, sehingga proses optimisasi adalah optimalisasi hill-climbing di mana pada akhirnya anchor ditempatkan sedemikian rupa sehingga gaya berada dalam kesetimbangan. Tombol Optimize digunakan untuk menjalankan proses optimasi. Hasil optimasi mungkin tergantung pada penempatan awal jangkar, yang dapat diatur dalam lingkaran, secara acak atau bahkan secara manual. Yang berikutnya juga berfungsi pada setiap tahap optimasi, dan kami sarankan untuk bermain dengan opsi ini untuk memahami bagaimana perubahan satu jangkar mempengaruhi posisi titik data. Dalam setiap proyeksi linier, proyeksi vektor satuan yang sangat pendek dibandingkan dengan yang lain menunjukkan bahwa atribut terkaitnya tidak terlalu informatif untuk tugas klasifikasi tertentu. Vektor tersebut, yaitu jangkar yang sesuai, dapat disembunyikan dari visualisasi menggunakan bilah Radius slider di Show anchors box. |
| − | [[File:Freeviz-zoo-stamped.png|center| | + | [[File:Freeviz-zoo-stamped.png|center|400px|thumb]] |
* Two initial positions of anchors are possible: random and circular. Optimization moves anchors in an optimal position. | * Two initial positions of anchors are possible: random and circular. Optimization moves anchors in an optimal position. | ||
| Line 36: | Line 36: | ||
==Manually move anchors== | ==Manually move anchors== | ||
| − | [[File:Freeviz-moveanchor.png|center| | + | [[File:Freeviz-moveanchor.png|center|600px|thumb]] |
One can manually move anchors. Use a mouse pointer and hover above the end of an anchor. Click the left button and then you can move selected anchor where ever you want. | One can manually move anchors. Use a mouse pointer and hover above the end of an anchor. Click the left button and then you can move selected anchor where ever you want. | ||
| Line 45: | Line 45: | ||
Signal data outputs a data table with an additional column that contains group indices. | Signal data outputs a data table with an additional column that contains group indices. | ||
| − | [[File:FreeViz-selection.png|center| | + | [[File:FreeViz-selection.png|center|600px|thumb]] |
| Line 52: | Line 52: | ||
The FreeViz, as the rest of Orange widgets, supports zooming-in and out of part of the plot and a manual selection of data instances. These functions are available in the lower left corner of the widget. The default tool is Select, which selects data instances within the chosen rectangular area. Pan enables you to move the plot around the pane. With Zoom you can zoom in and out of the pane with a mouse scroll, while Reset zoom resets the visualization to its optimal size. An example of a simple schema, where we selected data instances from a rectangular region and sent them to the Data Table widget, is shown below. | The FreeViz, as the rest of Orange widgets, supports zooming-in and out of part of the plot and a manual selection of data instances. These functions are available in the lower left corner of the widget. The default tool is Select, which selects data instances within the chosen rectangular area. Pan enables you to move the plot around the pane. With Zoom you can zoom in and out of the pane with a mouse scroll, while Reset zoom resets the visualization to its optimal size. An example of a simple schema, where we selected data instances from a rectangular region and sent them to the Data Table widget, is shown below. | ||
| − | [[File:FreeViz-Example-Explorative.png|center| | + | [[File:FreeViz-Example-Explorative.png|center|600px|thumb]] |
Revision as of 06:18, 11 April 2020
Sumber: https://docs.biolab.si//3/visual-programming/widgets/visualize/freeviz.html
Widget FreeViz menayangkan FreeViz projection.
Input
Data: input dataset
Data Subset: subset of instances
Output
Selected Data: instances selected from the plot
Data: data with an additional column showing whether a point is selected
Components: FreeViz vectors
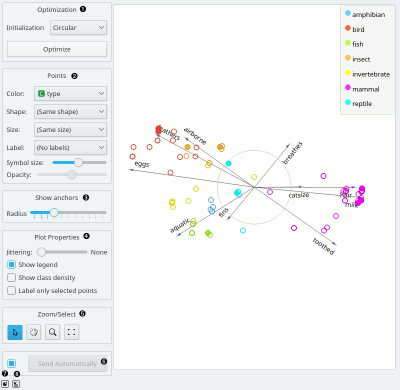
FreeViz menggunakan paradigma yang dipinjam dari particle physics: titik-titik dalam kelas yang sama akan menarik satu sama lain, sedangkan mereka yang berasal dari kelas yang berbeda akan saling tolak satu sama lain, dan gaya yang dihasilkan diberikan pada jangkar atribut, yaitu, pada vektor satuan dari masing-masing dimensional axis. Poin tidak dapat bergerak (diproyeksikan dalam ruang proyeksi), tetapi atribut anchor dapat, sehingga proses optimisasi adalah optimalisasi hill-climbing di mana pada akhirnya anchor ditempatkan sedemikian rupa sehingga gaya berada dalam kesetimbangan. Tombol Optimize digunakan untuk menjalankan proses optimasi. Hasil optimasi mungkin tergantung pada penempatan awal jangkar, yang dapat diatur dalam lingkaran, secara acak atau bahkan secara manual. Yang berikutnya juga berfungsi pada setiap tahap optimasi, dan kami sarankan untuk bermain dengan opsi ini untuk memahami bagaimana perubahan satu jangkar mempengaruhi posisi titik data. Dalam setiap proyeksi linier, proyeksi vektor satuan yang sangat pendek dibandingkan dengan yang lain menunjukkan bahwa atribut terkaitnya tidak terlalu informatif untuk tugas klasifikasi tertentu. Vektor tersebut, yaitu jangkar yang sesuai, dapat disembunyikan dari visualisasi menggunakan bilah Radius slider di Show anchors box.
- Two initial positions of anchors are possible: random and circular. Optimization moves anchors in an optimal position.
- Set the color of the displayed points (you will get colors for discrete values and grey-scale points for continuous). Set label, shape and size to differentiate between points. Set symbol size and opacity for all data points.
- Anchors inside a circle are hidden. Circle radius can be be changed using a slider.
- Adjust plot properties:
- Set jittering to prevent the dots from overlapping (especially for discrete attributes).
- Show legend displays a legend on the right. Click and drag the legend to move it.
- Show class density colors the graph by class (see the screenshot below).
- Label only selected points allows you to select individual data instances and label them.
- Select, zoom, pan and zoom to fit are the options for exploring the graph. The manual selection of data instances works as an angular/square selection tool. Double click to move the projection. Scroll in or out for zoom.
- If Send automatically is ticked, changes are communicated automatically. Alternatively, press Send.
- Save Image saves the created image to your computer in a .svg or .png format.
- Produce a report.
Manually move anchors
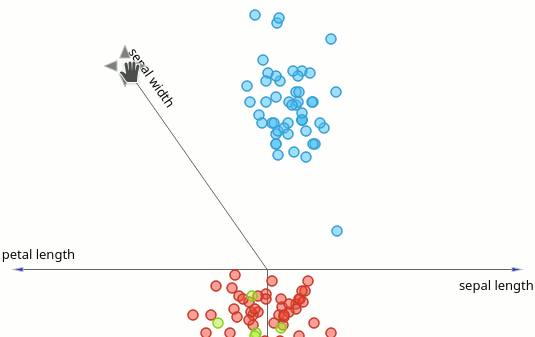
One can manually move anchors. Use a mouse pointer and hover above the end of an anchor. Click the left button and then you can move selected anchor where ever you want. Selection
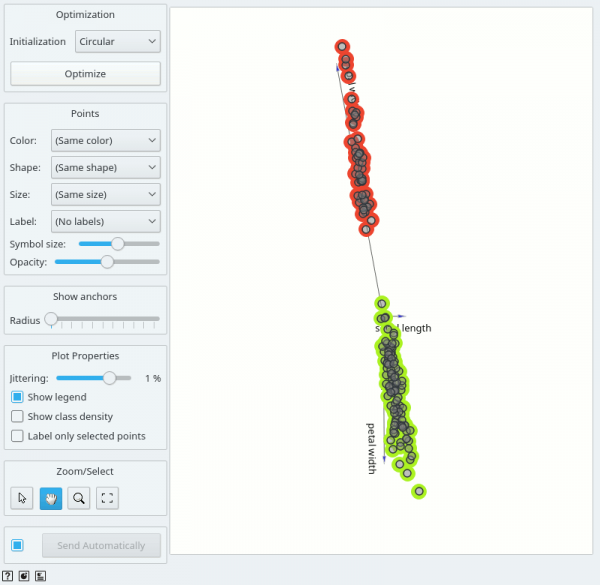
Selection can be used to manually defined subgroups in the data. Use Shift modifier when selecting data instances to put them into a new group. Shift + Ctrl (or Shift + Cmd on macOs) appends instances to the last group.
Signal data outputs a data table with an additional column that contains group indices.
Explorative Data Analysis
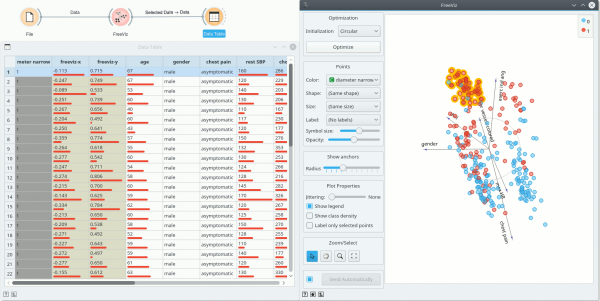
The FreeViz, as the rest of Orange widgets, supports zooming-in and out of part of the plot and a manual selection of data instances. These functions are available in the lower left corner of the widget. The default tool is Select, which selects data instances within the chosen rectangular area. Pan enables you to move the plot around the pane. With Zoom you can zoom in and out of the pane with a mouse scroll, while Reset zoom resets the visualization to its optimal size. An example of a simple schema, where we selected data instances from a rectangular region and sent them to the Data Table widget, is shown below.


