Difference between revisions of "Orange: Feature Statistics"
Onnowpurbo (talk | contribs) |
Onnowpurbo (talk | contribs) |
||
| Line 2: | Line 2: | ||
| − | + | Tampilkan statistik dasar untuk data feature. | |
==Input== | ==Input== | ||
| Line 13: | Line 13: | ||
Statistics: table containing statistics of the selected features | Statistics: table containing statistics of the selected features | ||
| − | + | Feature Statistics widgetr menyediakan cara cepat untuk memeriksa dan menemukan feature menarik dalam kumpulan data yang diberikan. | |
[[File:Feature statistics-stamped.png|center|200px|thumb]] | [[File:Feature statistics-stamped.png|center|200px|thumb]] | ||
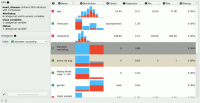
| − | + | Feature Statistics widget padaheart-disease data set. Feature yang dijalankan secara manual diubah menjadi variabel meta untuk tujuan ilustrasi. | |
* Info on the current data set size and number and types of features | * Info on the current data set size and number and types of features | ||
| Line 31: | Line 31: | ||
* The number of missing values in the data. | * The number of missing values in the data. | ||
| − | + | Perhatikan juga bahwa beberapa baris berwarna berbeda. Baris putih menunjukkan feature reguler, baris abu-abu menunjukkan variabel class dan abu-abu yang lebih terang menunjukkan variabel meta. | |
==Contoh== | ==Contoh== | ||
| − | + | Feature Statistics widget paling sering digunakan setelah File widget untuk memeriksa dan menemukan feature yang berpotensi menarik dalam data set yang diberikan. Dalam contoh berikut, kita menggunakan heart-disease data set. | |
[[File:Feature statistics workflow.png|center|200px|thumb]] | [[File:Feature statistics workflow.png|center|200px|thumb]] | ||
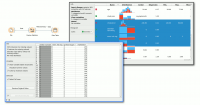
| − | + | Setelah kita menemukan subset feature yang berpotensi menarik, atau kita telah menemukan feature yang ingin kita kecualikan, kita dapat dengan mudah memilih feature yang ingin kita pertahankan. Widget mengeluarkan set data baru dengan hanya feature-feature ini. | |
| − | |||
[[File:Feature statistics example1.png|center|200px|thumb]] | [[File:Feature statistics example1.png|center|200px|thumb]] | ||
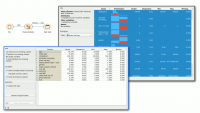
| − | + | Atau, jika kita ingin menyimpan statistik feature, kita dapat menggunakan output Statistik dan memanipulasi nilai-nilai itu sesuai kebutuhan. Dalam contoh ini, kita cukup memilih semua fitur dan menampilkan statistik dalam tabel. | |
[[File:Feature statistics example2.png|center|200px|thumb]] | [[File:Feature statistics example2.png|center|200px|thumb]] | ||
Revision as of 10:27, 2 February 2020
Sumber: https://docs.biolab.si//3/visual-programming/widgets/data/featurestatistics.html
Tampilkan statistik dasar untuk data feature.
Input
Data: input data
Output
Reduced data: table containing only selected features
Statistics: table containing statistics of the selected features
Feature Statistics widgetr menyediakan cara cepat untuk memeriksa dan menemukan feature menarik dalam kumpulan data yang diberikan.
Feature Statistics widget padaheart-disease data set. Feature yang dijalankan secara manual diubah menjadi variabel meta untuk tujuan ilustrasi.
- Info on the current data set size and number and types of features
- The histograms on the right can be colored by any feature. If the selected feature is categorical, a discrete color palette is used (as shown in the example). If the selected feature is numerical, a continuous color palette is used. The table on the right contains statistics about each feature in the data set. The features can be sorted by each statistic, which we now describe.
- The feature type - can be one of categorical, numeric, time and string.
- The name of the feature.
- A histogram of feature values. If the feature is numeric, we appropriately discretize the values into bins. If the feature is categorical, each value is assigned its own bar in the histogram.
- The central tendency of the feature values. For categorical features, this is the mode. For numeric features, this is mean value.
- The dispersion of the feature values. For categorical features, this is the entropy of the value distribution. For numeric features, this is the coefficient of variation.
- The minimum value. This is computed for numerical and ordinal categorical features.
- The maximum value. This is computed for numerical and ordinal categorical features.
- The number of missing values in the data.
Perhatikan juga bahwa beberapa baris berwarna berbeda. Baris putih menunjukkan feature reguler, baris abu-abu menunjukkan variabel class dan abu-abu yang lebih terang menunjukkan variabel meta.
Contoh
Feature Statistics widget paling sering digunakan setelah File widget untuk memeriksa dan menemukan feature yang berpotensi menarik dalam data set yang diberikan. Dalam contoh berikut, kita menggunakan heart-disease data set.
Setelah kita menemukan subset feature yang berpotensi menarik, atau kita telah menemukan feature yang ingin kita kecualikan, kita dapat dengan mudah memilih feature yang ingin kita pertahankan. Widget mengeluarkan set data baru dengan hanya feature-feature ini.
Atau, jika kita ingin menyimpan statistik feature, kita dapat menggunakan output Statistik dan memanipulasi nilai-nilai itu sesuai kebutuhan. Dalam contoh ini, kita cukup memilih semua fitur dan menampilkan statistik dalam tabel.


