VoIP Cookbook: Monitor VoIP Performance
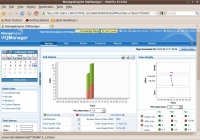
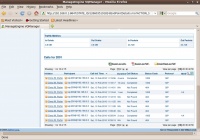
The Web front end of VQManager. We can easily see the call volume, including the success call, the failed calls. On the right, we can see the quality of calls in general, including, its delay, jitter, packet loss, MOS, R-Factor.
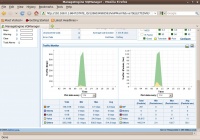
At the end, of the Web Front end. On the left, we can see traffic passing in Kbps. On the right, we can see traffic passing in packet per second. In addition, we can see the type of traffic passing through our system.
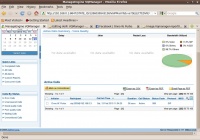
In VQManager call menu, we can see in summery of calls, including, the usage profile. In addition, we can see the active call at the moment.
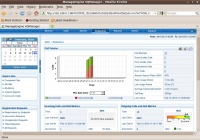
In the Endpoint menu, we can see a more detailed information of particular endpoint, such as, its activities, performance and usage. On the left, we can see the usage activities. On the right, we can see more detailed on the statistics and voice quality. Below it, we can see more detailed on the incoming and outgoing call QoS.
At the bottom of endpoint menu, we can see detailed calls performed by the particular endpoint.
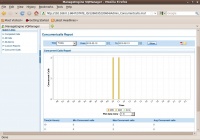
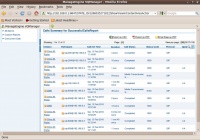
In Concurrent Call Report menu, we can easily see how many concurrent call is handled by the softswitch. In addition, we can also see the peak hours of the traffic and its total and average concurrent calls.
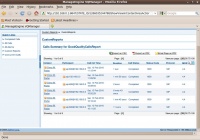
Through Report Menu -> GoodQualityCallsReport, we can easily see the good quality call made through our softswitch.
Through Report Menu -> Unsuccessful Calls Report, we can the unsuccessfull calls. We may furthjer analyze the failure reasons.
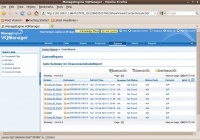
Through Report Menu -> SuccessfulCallsReport, we can see the report on the successful call through our softswitch.
