Orange: Test and Score
Sumber: https://docs.biolab.si//3/visual-programming/widgets/evaluate/testandscore.html
Widget Test & Score men-test algoritma learning pada data.
Input
Data: input dataset
Test Data: separate data for testing
Learner: learning algorithm(s)
Output
Evaluation Results: results of testing classification algorithms
Widget Test & Score akan menguji algoritma learning. Skema pengambilan sampel yang berbeda tersedia, termasuk menggunakan test data yang terpisah. Widget Test & Score melakukan dua hal. Pertama, widget Test & Score akan menunjukkan tabel dengan ukuran kinerja classifier yang berbeda, seperti akurasi klasifikasi dan area di bawah kurva. Kedua, output hasil evaluasi, yang dapat digunakan oleh widget lain untuk menganalisis kinerja pengklasifikasi, seperti widget ROC Analysis atau widget Confusion Matrix.
Signal Learner mempunyai property uncommon: ini bisa di sambungkan ke lebih dari satu widget untuk men-test banyak learner dengan prosedur yang sama.
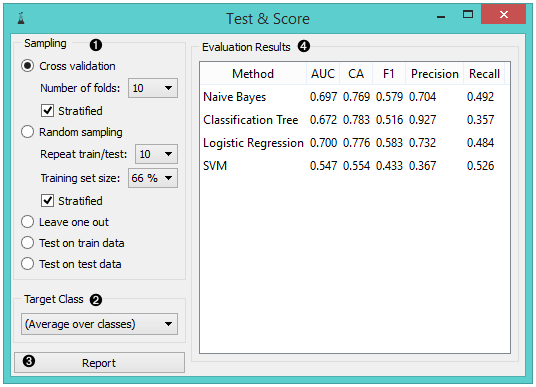
- The widget supports various sampling methods.
- Cross-validation splits the data into a given number of folds (usually 5 or 10). The algorithm is tested by holding out examples from one fold at a time; the model is induced from other folds and examples from the held out fold are classified. This is repeated for all the folds.
- Leave-one-out is similar, but it holds out one instance at a time, inducing the model from all others and then classifying the held out instances. This method is obviously very stable, reliable… and very slow.
- Random sampling randomly splits the data into the training and testing set in the given proportion (e.g. 70:30); the whole procedure is repeated for a specified number of times.
- Test on train data uses the whole dataset for training and then for testing. This method practically always gives wrong results.
- Test on test data: the above methods use the data from Data signal only. To input another dataset with testing examples (for instance from another file or some data selected in another widget), we select Separate Test Data signal in the communication channel and select Test on test data.
- For classification, Target class can be selected at the bottom of the widget. When Target class is (Average over classes), methods return scores that are weighted averages over all classes. For example, in case of the classifier with 3 classes, scores are computed for class 1 as a target class, class 2 as a target class, and class 3 as a target class. Those scores are averaged with weights based on the class size to retrieve the final score.
- Produce a report.
- The widget will compute a number of performance statistics:
- Classification
- Area under ROC is the area under the receiver-operating curve.
- Classification accuracy is the proportion of correctly classified examples.
- F-1 is a weighted harmonic mean of precision and recall (see below).
- Precision is the proportion of true positives among instances classified as positive, e.g. the proportion of Iris virginica correctly identified as Iris virginica.
- Recall is the proportion of true positives among all positive instances in the data, e.g. the number of sick among all diagnosed as sick.
- Regression
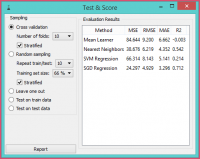
- MSE measures the average of the squares of the errors or deviations (the difference between the estimator and what is estimated).
- RMSE is the square root of the arithmetic mean of the squares of a set of numbers (a measure of imperfection of the fit of the estimator to the data)
- MAE is used to measure how close forecasts or predictions are to eventual outcomes.
- R2 is interpreted as the proportion of the variance in the dependent variable that is predictable from the independent variable.
Contoh
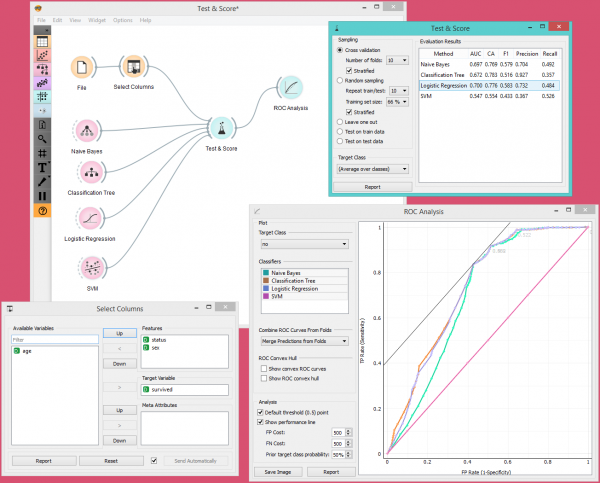
Dalam penggunaan widget Test & Score yang biasa, kita akan memasukan set data dan beberapa algoritma learning dan kita mengamati kinerjanya dalam tabel di dalam widget Test & Score dan di widget ROC Analysis. Data sering diproses sebelumnya sebelum pengujian; dalam hal ini kami melakukan beberapa pilihan feature manual (widget Select Columns) pada dataset Titanic, di mana kita hanya ingin mengetahui jenis kelamin dan status orang yang selamat dan mengabaikan age (usia).
Contoh lain penggunaan widget ini di jelaskan di dokumentasi Confusion Matrix widget.


