Orange: Principal Component Analysis
Sumber: https://orange.biolab.si/workflows/
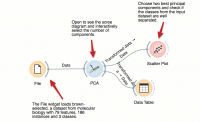
PCA mengubah data menjadi dataset dengan variabel tidak berkorelasi, juga disebut principal components. Widget PCA menampilkan grafik (diagram scree) yang menunjukkan tingkat perbedaan yang dijelaskan oleh best principal components dan memungkinkan untuk secara interaktif mengatur jumlah komponen yang akan dimasukkan dalam dataset keluaran. Dalam workflow ini, kita bisa mengamati transformasi di Tabel Data dan di Scatter Plot.
The workflow in Orange Data Mining shown in the picture follows a Principal Component Analysis (PCA) approach for dimensionality reduction and visualization. Here’s the step-by-step breakdown:
1. File (Data Loading)
- The File widget loads the dataset named "brown-selected", which is from molecular biology.
- The dataset contains 79 features, 186 instances, and 3 classes.
2. PCA (Dimensionality Reduction)
- The PCA (Principal Component Analysis) widget is used to reduce the dataset's dimensionality.
- Users can open the scree diagram to interactively select the number of principal components.
- PCA helps in identifying the most important features that explain the variance in the dataset.
3. Data Table (Exploring Transformed Data)
- The Data Table widget displays the transformed dataset after applying PCA.
- It allows users to inspect how the original data is represented in the new principal components.
4. Scatter Plot (Visualizing Principal Components)
- The Scatter Plot widget is used to plot the two best principal components.
- This helps in checking whether the classes in the input dataset are well separated.
- If the classes are well-separated in the plot, it indicates that PCA has successfully captured meaningful variations in the data.
Summary
This Orange Data Mining workflow loads a molecular biology dataset, applies PCA for dimensionality reduction, and then visualizes the principal components using a scatter plot to check if different classes are well-separated. The Data Table is used for further exploration of the transformed data. This approach is useful for feature selection, data visualization, and understanding class separability in high-dimensional datasets.
