Orange: Pivot Table Example
Sumber: https://orange.biolab.si/workflows/
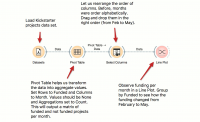
Pivot Table dapat membantu kita untuk mengumpulkan dan mengubah data. Workflow ini mengambil proyek-proyek Kickstarter dan mengagregasinya berdasarkan bulan. Kita dapat memeriksa frekuensi proyek yang diterbitkan per bulan dan mengamati perbedaan antara proyek yang didanai dan yang tidak didanai. Coba buat beberapa tabel dengan pivot dan bereksperimen dengan metode agregasi yang berbeda.
CATATAN: Pivot table adalah tabel statistik yang merangkum data dari tabel yang lebih luas. Ringkasan ini mungkin termasuk jumlah, rata-rata, atau statistik lainnya, yang tabel pivot dikelompokkan bersama-sama dengan cara yang bermakna. Tabel pivot adalah teknik dalam data processing.
The workflow in Orange Data Mining shown in the image follows a data aggregation and visualization approach using a Pivot Table and Line Plot to analyze Kickstarter project funding trends. Here’s the step-by-step breakdown:
1. Datasets (Loading Data)
- The Datasets widget loads the Kickstarter projects dataset.
- This dataset includes information about projects, their funding status, and the months when they were funded.
2. Pivot Table (Transforming Data)
- The Pivot Table widget is used to aggregate data for analysis.
- Configuration:
** Rows are set to "Funded" (indicating whether a project was funded or not).
** Columns are set to "Month" (to analyze trends over time).
** Values should be None (since we are counting occurrences rather than summing values).
** Aggregations are set to Count to compute the number of funded and non-funded projects per month.
- This transformation creates a matrix showing how many projects were funded or not for each month.
3. Select Columns (Rearranging Data)
- The Select Columns widget allows for reordering the months, ensuring that the months appear in the correct chronological order (February to May instead of an alphabetical order).
4. Line Plot (Visualizing Funding Trends)
- The Line Plot widget is used to observe funding per month.
- The data is grouped by Funded (i.e., funded vs. non-funded projects).
- The plot helps track how funding trends changed over time from February to May.
Summary
This Orange Data Mining workflow loads a Kickstarter dataset, aggregates the number of funded and non-funded projects using a Pivot Table, reorders the months, and visualizes funding trends in a Line Plot. This process helps analyze funding patterns over time and understand how successful project funding evolved across months.
Source
YOUTUBE
- [YOUTUBE: https://www.youtube.com/watch?v=k-fkb6z61DQ ORANGE: Pivot Data]
- YOUTUBE: https://www.youtube.com/watch?v=nY3v9a68EaU
