Data Science: Overview
The attached figure represents the Data Science Workflow, illustrating the key stages in a structured data science process. It begins with Problem Definition, where the business or research problem is clearly identified to ensure the right objectives are set. Next is Data Preparation, which involves gathering, cleaning, and transforming raw data into a usable format. This step ensures that the dataset is structured and free from inconsistencies, making it ready for analysis.
Following preparation, the Data Exploration phase focuses on analyzing patterns, trends, and relationships within the data. This helps data scientists gain insights and identify potential features for modeling. The Modeling stage involves applying machine learning or statistical models to make predictions or classifications. Once a model is developed, the Evaluation phase assesses its accuracy and performance using validation techniques. Finally, the Deployment stage integrates the model into real-world applications, ensuring it provides value to end-users. This workflow ensures a systematic approach to solving complex data problems efficiently.
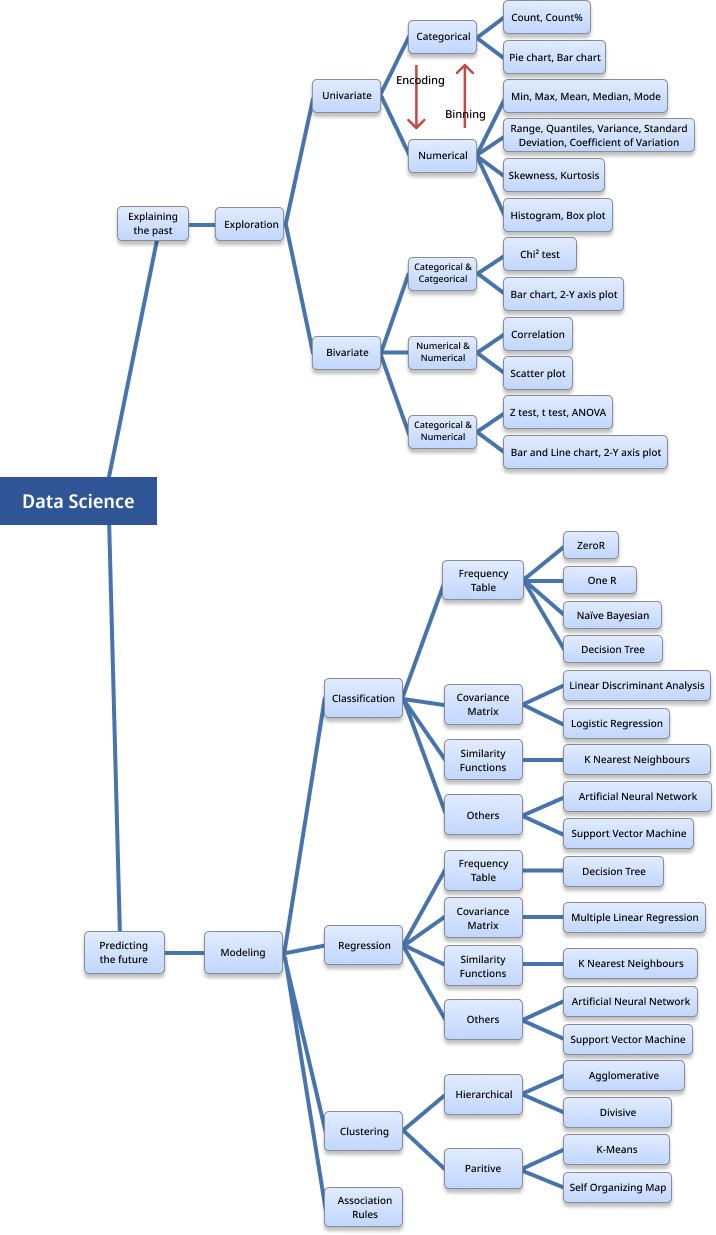
The figure represents a Data Science Workflow, breaking down how data is explored and modeled to explain past patterns and predict future outcomes.
1. Exploration (Explaining the Past)
- Data is first analyzed using Univariate Analysis, where we look at a single variable at a time.
- Categorical Data (e.g., types of fruits, colors) is analyzed using counts, percentages, and visualized with pie or bar charts.
- Numerical Data (e.g., prices, ages) is analyzed using statistical measures like mean, median, standard deviation, and visualized with histograms or box plots.
- Next, Bivariate Analysis compares two variables:
- Categorical vs. Categorical → Uses Chi² test and bar charts.
- Numerical vs. Numerical → Uses correlation and scatter plots.
- Categorical vs. Numerical → Uses t-tests, ANOVA, and line charts.
2. Modeling (Predicting the Future)
- Classification: Used to categorize data into groups (e.g., spam vs. non-spam emails). Common techniques include Decision Trees, Naïve Bayes, Logistic Regression, Neural Networks, and Support Vector Machines.
- Regression: Used to predict continuous values (e.g., predicting house prices). Common methods include Multiple Linear Regression, Neural Networks, and K-Nearest Neighbors.
- Clustering: Groups data into similar categories without predefined labels (e.g., customer segmentation). Methods include K-Means, Hierarchical Clustering, and Self-Organizing Maps.
- Association Rules: Identifies relationships between variables (e.g., "Customers who buy bread often buy butter too").
This workflow helps data scientists analyze trends, find relationships in data, and build models for making predictions.

