Orange: Select Rows
Sumber: https://docs.biolab.si//3/visual-programming/widgets/data/selectrows.html
Selects data instances based on conditions over data features.
Input
Data: input dataset
Output
Matching Data: instances that match the conditions
Non-Matching Data: instances that do not match the conditions
Data: data with an additional column showing whether a instance is selected
This widget selects a subset from an input dataset, based on user-defined conditions. Instances that match the selection rule are placed in the output Matching Data channel.
Criteria for data selection are presented as a collection of conjunct terms (i.e. selected items are those matching all the terms in ‘Conditions’).
Condition terms are defined through selecting an attribute, selecting an operator from a list of operators, and, if needed, defining the value to be used in the condition term. Operators are different for discrete, continuous and string attributes.
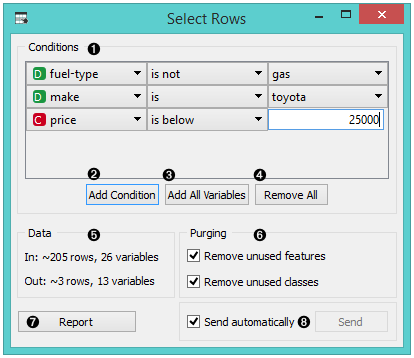
- Conditions you want to apply, their operators and related values
- Add a new condition to the list of conditions.
- Add all the possible variables at once.
- Remove all the listed variables at once.
- Information on the input dataset and information on instances that match the condition(s)
- Purge the output data.
- When the Send automatically box is ticked, all changes will be automatically communicated to other widgets.
- Produce a report.
Any change in the composition of the condition will update the information pane (Data Out).
If Send automatically is selected, then the output is updated on any change in the composition of the condition or any of its terms.
Contoh
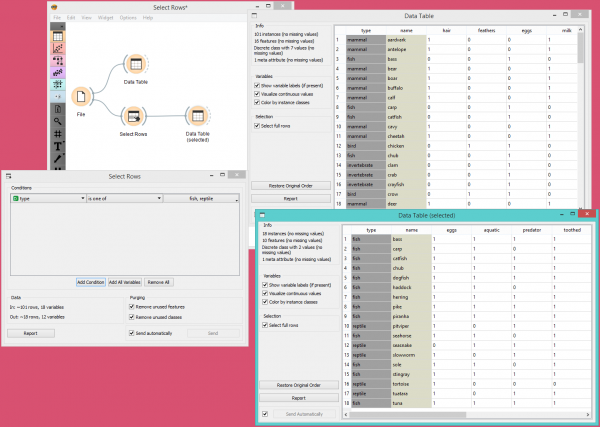
Dalam workflow di bawah ini, kita menggunakan data Zoo dari widget File dan memasukkannya ke dalam widget Select Rows. Di widget, kita memilih untuk hanya mengeluarkan dua jenis hewan, yaitu ikan dan reptil. Kita dapat memeriksa dataset asli dan dataset dengan baris yang dipilih di widget Tabel Data.
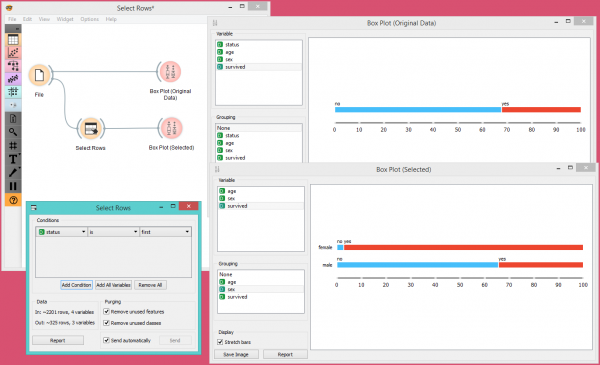
Dalam contoh berikut, kita menggunakan data dari dataset Titanic dan juga memasukkannya ke dalam widget Box Plot. Kita pertama kali mengamati seluruh dataset berdasarkan kelangsungan hidup. Kemudian kami memilih hanya penumpang kelas satu di widget Select Rows dan memasukkannya lagi ke Box Plot. Di sana kita bisa melihat semua penumpang kelas satu terdaftar berdasarkan tingkat kelangsungan hidup mereka dan dikelompokkan berdasarkan gender.


