Difference between revisions of "Orange: Pythagorean Tree"
Onnowpurbo (talk | contribs) |
Onnowpurbo (talk | contribs) |
||
| Line 31: | Line 31: | ||
** Report: add visualization to the report. | ** Report: add visualization to the report. | ||
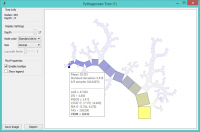
| − | Pythagorean Tree | + | Pythagorean Tree dapat memvisualisasikan classification dan regression tree. Di bawah ini adalah contoh untuk regression tree. Satu-satunya perbedaan antara keduanya adalah bahwa regression treei tidak memungkinkan pewarnaan berdasarkan class, tetapi dapat mewarnai dengan rata-rata class atau standar deviasi. |
[[File:Pythagorean-Tree1-continuous.png|center|200px|thumb]] | [[File:Pythagorean-Tree1-continuous.png|center|200px|thumb]] | ||
Revision as of 10:47, 6 February 2020
Sumber: https://docs.biolab.si//3/visual-programming/widgets/visualize/pythagoreantree.html
Pythagorean tree visualization untuk klasifikasi atau regression tree.
Input
Tree: tree model
Selected Data: instances selected from the tree
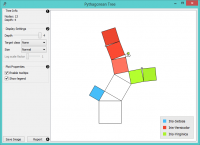
Pythagorean Trees adalah bidang fraktal yang dapat digunakan untuk menggambarkan hierarki tree umum seperti yang disajikan dalam sebuah artikel oleh Fabian Beck dan rekan-rekan-nya. Dalam kasus kita, ini digunakan untuk memvisualisasikan dan menjelajahi model tree.
- Information on the input tree model.
- Visualization parameters:
- Depth: set the depth of displayed trees.
- Target class (for classification trees): the intensity of the color for nodes of the tree will correspond to the probability of the target class. If None is selected, the color of the node will denote the most probable class.
- Node color (for regression trees): node colors can correspond to mean or standard deviation of class value of the training data instances in the node.
- Size: define a method to compute the size of the square representing the node. Normal will keep node sizes correspond to the size of training data subset in the node. Square root and Logarithmic are the respective transformations of the node size.
- Log scale factor is only enabled when logarithmic transformation is selected. You can set the log factor between 1 and 10.
- Plot properties:
- Enable tooltips: display node information upon hovering.
- Show legend: shows color legend for the plot.
- Reporting:
- Save Image: save the visualization to a SVG or PNG file.
- Report: add visualization to the report.
Pythagorean Tree dapat memvisualisasikan classification dan regression tree. Di bawah ini adalah contoh untuk regression tree. Satu-satunya perbedaan antara keduanya adalah bahwa regression treei tidak memungkinkan pewarnaan berdasarkan class, tetapi dapat mewarnai dengan rata-rata class atau standar deviasi.
Contoh
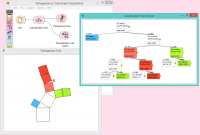
The workflow from the screenshot below demonstrates the difference between Tree Viewer and Pythagorean Tree. They can both visualize Tree, but Pythagorean visualization takes less space and is more compact, even for a small Iris flower dataset. For both visualization widgets, we have hidden the control area on the left by clicking on the splitter between control and visualization area.
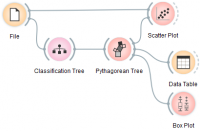
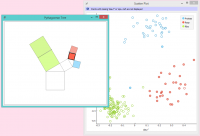
Pythagorean Tree is interactive: click on any of the nodes (squares) to select training data instances that were associated with that node. The following workflow explores these feature.
The selected data instances are shown as a subset in the Scatter Plot, sent to the Data Table and examined in the Box Plot. We have used brown-selected dataset in this example. The tree and scatter plot are shown below; the selected node in the tree has a black outline.
Referensi
Beck, F., Burch, M., Munz, T., Di Silvestro, L. and Weiskopf, D. (2014). Generalized Pythagoras Trees for Visualizing Hierarchies. In IVAPP ‘14 Proceedings of the 5th International Conference on Information Visualization Theory and Applications, 17-28.
