Orange: Pythagorean Forest
Sumber: https://docs.biolab.si//3/visual-programming/widgets/visualize/pythagoreanforest.html
Widget Pythagorean forest untuk mem-visualisasi random forests.
Input
Random Forest: tree models from random forest
Output
Tree: selected tree model
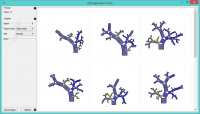
Widget Pythagorean Forest menunjukkan semua decision tree model yang dipelajari dari widget Random Forest. Widget Pythagorean Foret akan menampilkan mereka sebagai Pythagorean tree, masing-masing visualisasi berkaitan dengan satu pohon yang dibangun secara acak. Dalam visualisasi, kita dapat memilih sebuah tree dan menampilkannya di widget Pythagorean Tree. Tree terbaik adalah yang memiliki cabang terpendek dan berwarna paling kuat. Ini berarti beberapa atribut membagi cabang dengan baik.
Widget Pythagorean Forest dapat menampilkan hasil klasifikasi dan regresi. Klasifikasi membutuhkan variabel target diskrit dalam dataset, sedangkan regresi memerlukan variabel target kontinu. Namun, keduanya harus diberi inputan / masukan Tree pada input-nya.
- Information on the input random forest model.
- Display parameters:
- Depth: set the depth to which the trees are grown.
- Target class: set the target class for coloring the trees. If None is selected, the tree will be white. If the input is a classification tree, you can color the nodes by their respective class. If the input is a regression tree, the options are Class mean, which will color tree nodes by the class mean value and Standard deviation, which will color them by the standard deviation value of the node.
- Size: set the size of the nodes. Normal will keep the nodes the size of the subset in the node. Square root and Logarithmic are the respective transformations of the node size.
- Zoom: allows you to see the size of the tree visualizations.
- Save Image: save the visualization to your computer as a .svg or .png file. Report: produce a report.
Contoh
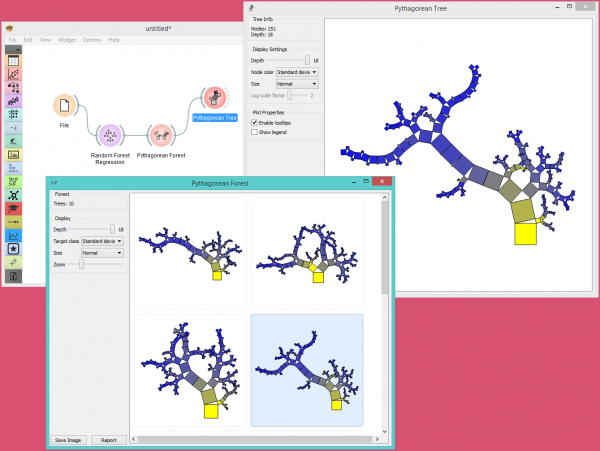
Widget Pythagorean Forest sangat baik untuk memvisualisasikan beberapa tree yang dibangun sekaligus. Dalam contoh di bawah ini, kita menggunakan dataset housing dan memplot 10 tree yang kita bangun dengan widget Random Forest. Saat mengubah parameter di widget Random Forest, visualisasi di widget Pythagorean Forest juga akan berubah.
Kemudian kita memilih tree dalam visualisasi dan memeriksanya lebih lanjut dengan widget Pythagoran Tree.
Referensi
Beck, F., Burch, M., Munz, T., Di Silvestro, L. and Weiskopf, D. (2014). Generalized Pythagoras Trees for Visualizing Hierarchies. In IVAPP ‘14 Proceedings of the 5th International Conference on Information Visualization Theory and Applications, 17-28.

