Orange: Network From Distances
Sumber: https://orange.biolab.si/widget-catalog/networks/networkfromdistances/
Constructs a network from distances between instances.
Inputs
Distances: A distance matrix.
Outputs
   Network: An instance of Network Graph.
   Data: Attribute-valued data set.
   Distances: A distance matrix.
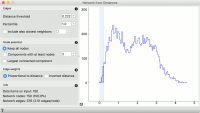
Network from Distances constructs a network graph from a given distance matrix. Graph is constructed by connecting nodes from the matrix where the distance between nodes is below the given threshold. In other words, all instances with a distance lower than the selected threshold, will be connected.
   Edges:
       Distance threshold: a closeness threshold for the formation of edges.
       Percentile: the percentile of data instances to be connected.
       Include also closest neighbors: include a number of closest neighbors to the selected instances.
   Node selection:
       Keep all nodes: entire network is on the output.
       Components with at least X nodes: filters out nodes with less than the set number of nodes.
       Largest connected component: keep only the largest cluster.
   Edge weights:
       Proportional to distance: weights are set to reflect the distance (closeness).
       Inverted distance: weights are set to reflect the inverted distance (difference).
   Information on the constructed network:
       Data items on input: number of instances on the input.
       Network nodes: number of nodes in the network (and the percentage of the original data).
       Network edges: number of constructed edges/connections (and the average number of connections per node).
Example
Network from Distances creates networks from distance matrices. It can transform data sets from a data table via distance matrix into a network graph. This widget is great for visualizing instance similarity as a graph of connected instances.
We took iris.tab to visualize instance similarity in a graph. We sent the output of File widget to Distances, where we computed Euclidean distances between rows (instances). Then we sent the output of Distances to Network from Distances, where we set the distance threshold (how similar the instances have to be to draw an edge between them) to 0.222. We kept all nodes and set edge weights to proportional to distance.
Then we observed the constructed network in a Network Explorer. We colored the nodes by iris attribute.
Referensi
