Difference between revisions of "Orange: Model Evaluation"
Jump to navigation
Jump to search
Onnowpurbo (talk | contribs) (Created page with "Sumber: https://orange.biolab.si/widget-catalog/time-series/model_evaluation/ Evaluate different time series’ models. Inputs Time series: Time series as output by As...") |
Onnowpurbo (talk | contribs) |
||
| (5 intermediate revisions by the same user not shown) | |||
| Line 2: | Line 2: | ||
| − | + | Widget Model Evaluation meng-evaluasi berbagai model time series | |
| − | + | ==Input== | |
| − | + | Time series: Time series as output by As Timeseries widget. | |
| − | + | Time series model(s): The time series model(s) to evaluate (e.g. VAR or ARIMA). | |
| − | + | Widget Model Evaluation dapat mengevaluasi berbagai model time series. Dengan membandingkan error yang di dihasilkan, yaitu: | |
| − | + | * root mean squared error (RMSE) | |
| − | + | * median absolute error (MAE) | |
| − | + | * mean absolute percent error (MAPE) | |
| + | * prediction of change in direction (POCID) | ||
| + | * coefficient of determination (R²) | ||
| + | * Akaike information criterion (AIC) | ||
| + | * Bayesian information criterion (BIC). | ||
| − | + | [[File:Model-evaluation-stamped.png|center|600px|thumb]] | |
| − | + | * Number of folds for time series cross-validation. | |
| + | * Number of forecast steps to produce in each fold. | ||
| + | * Results for various error measures and information criteria on cross-validated and in-sample data. | ||
| − | + | [[File:Automatic-time-series-forecasting-71-638.jpg|center|200px|thumb]] | |
| + | |||
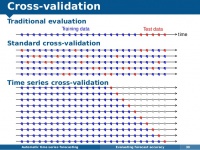
| + | Slide https://www.slideshare.net/hyndman/automatic-time-series-forecasting memperlihatkan bagaimana cara melakukan cross validation pada time series dilakukan. Dalam hal ini, jumlah dari folds (1) adalah 10 dan jumlah dari forecast steps di setiap fold (2) adalah 1. | ||
| + | |||
| + | In-sample errors adalah error yang di hitung pada training data itu sendiri. Sebuah model yang stabil adalah dimana in-sample errors dan out-of-sample errors tidak berbeda terlalu jauh. | ||
| + | |||
| + | ==See also== | ||
ARIMA Model, VAR Model | ARIMA Model, VAR Model | ||
Latest revision as of 09:32, 7 April 2020
Sumber: https://orange.biolab.si/widget-catalog/time-series/model_evaluation/
Widget Model Evaluation meng-evaluasi berbagai model time series
Input
Time series: Time series as output by As Timeseries widget.
Time series model(s): The time series model(s) to evaluate (e.g. VAR or ARIMA).
Widget Model Evaluation dapat mengevaluasi berbagai model time series. Dengan membandingkan error yang di dihasilkan, yaitu:
- root mean squared error (RMSE)
- median absolute error (MAE)
- mean absolute percent error (MAPE)
- prediction of change in direction (POCID)
- coefficient of determination (R²)
- Akaike information criterion (AIC)
- Bayesian information criterion (BIC).
- Number of folds for time series cross-validation.
- Number of forecast steps to produce in each fold.
- Results for various error measures and information criteria on cross-validated and in-sample data.
Slide https://www.slideshare.net/hyndman/automatic-time-series-forecasting memperlihatkan bagaimana cara melakukan cross validation pada time series dilakukan. Dalam hal ini, jumlah dari folds (1) adalah 10 dan jumlah dari forecast steps di setiap fold (2) adalah 1.
In-sample errors adalah error yang di hitung pada training data itu sendiri. Sebuah model yang stabil adalah dimana in-sample errors dan out-of-sample errors tidak berbeda terlalu jauh.
See also
ARIMA Model, VAR Model

