Difference between revisions of "Orange: Document Map"
Onnowpurbo (talk | contribs) |
Onnowpurbo (talk | contribs) |
||
| (6 intermediate revisions by the same user not shown) | |||
| Line 3: | Line 3: | ||
| − | + | Widget GeoMap menayangkan lokasi geographic yang melakukan mention di text. | |
| − | + | ==Input== | |
| − | + | Data: Data set. | |
| − | + | ==Output== | |
| − | + | Corpus: Documents containing mentions of selected geographical regions. | |
| − | + | Widget GeoMap menunjukkan geolokasi dari data text (string). Widget GeoMap menemukan mention nama geografis (negara dan ibu kota) dan menampilkan distribusi (frekuensi sebutan) dari nama-nama ini di peta. Peta Dokumen Widget berfungsi dengan widget Orange yang lain yang menghasilkan tabel data dan yang berisi setidaknya satu atribut string. Widget menampilkan instance data yang dipilih, yaitu semua dokumen yang berisi menyebutkan negara yang dipilih (atau negara). | |
| − | [[File:DocMap-stamped.png|center| | + | [[File:DocMap-stamped.png|center|600px|thumb]] |
| − | + | * Select the meta attribute you want to search geolocations by. The widget will find all mentions of geolocations in a text and display distributions on a map. | |
| − | + | * Select the type of map you wish to display. The options are World, Europe and USA. You can zoom in and out of the map by pressing + and - buttons on a map or by mouse scroll. | |
| − | + | * The legend for the geographic distribution of data. Countries with the boldest color are most often mentioned in the selected region attribute (highest frequency). | |
To select documents mentioning a specific country, click on a country and the widget will output matching documents. To select more than one country hold Ctrl/Cmd upon selection. | To select documents mentioning a specific country, click on a country and the widget will output matching documents. To select more than one country hold Ctrl/Cmd upon selection. | ||
| Line 25: | Line 25: | ||
==Contoh== | ==Contoh== | ||
| − | + | WIdget GeoMap dapat digunakan hanya untuk memvisualisasikan distribusi geolocations atau untuk analisis data interaktif yang lebih kompleks. Di sini, kita telah meminta widget NY Times untuk artikel di Slovenia untuk periode waktu tahun lalu (2015-2016). Pertama kami memeriksa hasilnya dengan widget Corpus Viewer. | |
| − | [[File:DocMap-Example.png|center| | + | [[File:DocMap-Example.png|center|600px|thumb]] |
| − | + | Kemudian kami mengirim data ke widget GeoMap untuk melihat distribusi atribut geolocations by country. Atribut tersebut sudah berisi tag negara untuk setiap artikel, itulah mengapa widget NY Times sangat bagus dalam kombinasi dengan widget GeoMap. Kita memilih Germany, yang mengirimkan semua dokumen yang ditandai dengan Germany ke output. Padahal, kita menanyakan widget NY Times untuk artikel di Slovenia, bukan Germany. | |
| − | |||
| − | |||
| − | |||
| − | |||
| + | Kami kembali dapat memeriksa output dengan widget Corpus Viewer. Tetapi ada cara yang lebih menarik untuk memvisualisasikan data. Kami telah mengirim dokumen yang dipilih ke widget Preprocess Text, tempat kami men-tokenized text ke words dan menghapus stopword. | ||
| + | Akhirnya, kita dapat memeriksa kata-kata teratas yang muncul dalam dokumen tahun yang kita inginkan di Slovenia dan menyebut juga Germany dengan widget Word Cloud. | ||
| + | ==Youtube== | ||
| + | * [https://www.youtube.com/watch?v=Jbxxrll55vI YOUTUBE: ORANGE GeoMap] | ||
==Referensi== | ==Referensi== | ||
Latest revision as of 05:28, 12 April 2020
Sumber: https://orange3-text.readthedocs.io/en/latest/widgets/docmap.html
Widget GeoMap menayangkan lokasi geographic yang melakukan mention di text.
Input
Data: Data set.
Output
Corpus: Documents containing mentions of selected geographical regions.
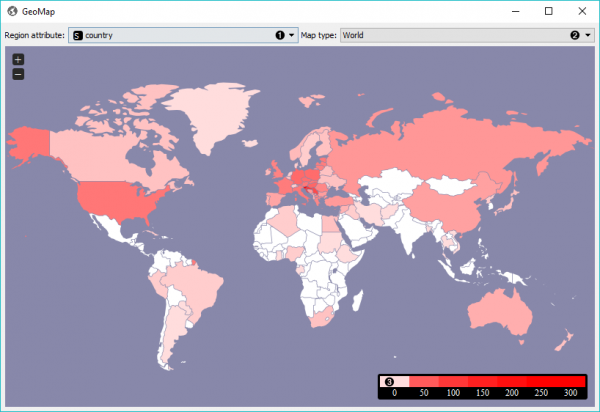
Widget GeoMap menunjukkan geolokasi dari data text (string). Widget GeoMap menemukan mention nama geografis (negara dan ibu kota) dan menampilkan distribusi (frekuensi sebutan) dari nama-nama ini di peta. Peta Dokumen Widget berfungsi dengan widget Orange yang lain yang menghasilkan tabel data dan yang berisi setidaknya satu atribut string. Widget menampilkan instance data yang dipilih, yaitu semua dokumen yang berisi menyebutkan negara yang dipilih (atau negara).
- Select the meta attribute you want to search geolocations by. The widget will find all mentions of geolocations in a text and display distributions on a map.
- Select the type of map you wish to display. The options are World, Europe and USA. You can zoom in and out of the map by pressing + and - buttons on a map or by mouse scroll.
- The legend for the geographic distribution of data. Countries with the boldest color are most often mentioned in the selected region attribute (highest frequency).
To select documents mentioning a specific country, click on a country and the widget will output matching documents. To select more than one country hold Ctrl/Cmd upon selection.
Contoh
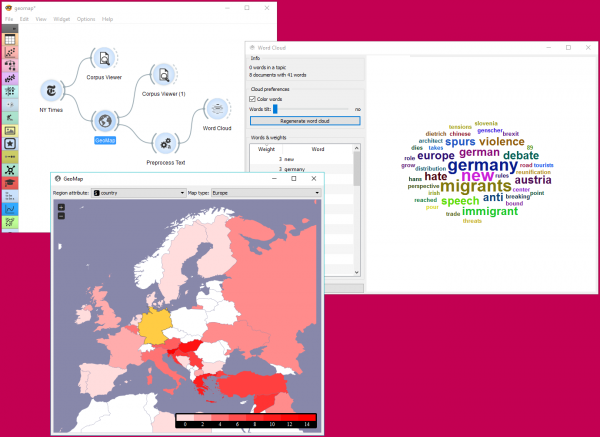
WIdget GeoMap dapat digunakan hanya untuk memvisualisasikan distribusi geolocations atau untuk analisis data interaktif yang lebih kompleks. Di sini, kita telah meminta widget NY Times untuk artikel di Slovenia untuk periode waktu tahun lalu (2015-2016). Pertama kami memeriksa hasilnya dengan widget Corpus Viewer.
Kemudian kami mengirim data ke widget GeoMap untuk melihat distribusi atribut geolocations by country. Atribut tersebut sudah berisi tag negara untuk setiap artikel, itulah mengapa widget NY Times sangat bagus dalam kombinasi dengan widget GeoMap. Kita memilih Germany, yang mengirimkan semua dokumen yang ditandai dengan Germany ke output. Padahal, kita menanyakan widget NY Times untuk artikel di Slovenia, bukan Germany.
Kami kembali dapat memeriksa output dengan widget Corpus Viewer. Tetapi ada cara yang lebih menarik untuk memvisualisasikan data. Kami telah mengirim dokumen yang dipilih ke widget Preprocess Text, tempat kami men-tokenized text ke words dan menghapus stopword.
Akhirnya, kita dapat memeriksa kata-kata teratas yang muncul dalam dokumen tahun yang kita inginkan di Slovenia dan menyebut juga Germany dengan widget Word Cloud.

