Orange: Data Mining for Business and Public Administration
Sumber: https://orange.biolab.si/blog/2017/11/17/data-mining-business-public-administration/
We’ve been having a blast with recent Orange workshops. While Blaž was getting tanned in India, Anže and I went to the charming Liverpool to hold a session for business school professors on how to teach business with Orange.
Obviously, when we say teach business, we mean how to do data mining for business, say predict churn or employee attrition, segment customers, find which items to recommend in an online store and track brand sentiment with text analysis.
For this purpose, we have made some updates to our Associate add-on and added a new data set to Data Sets widget which can be used for customer segmentation and discovering which item groups are frequently bought together. Like this:
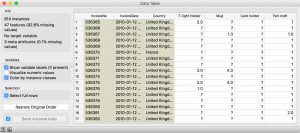
We load the Online Retail data set.
Since we have transactions in rows and items in columns, we have to transpose the data table in order to compute distances between items (rows). We could also simply ask Distances widget to compute distances between columns instead of rows. Then we send the transposed data table to Distances and compute cosine distance between items (cosine distance will only tell us, which items are purchased together, disregarding the amount of items purchased).
[[File:Screen-Shot-2017-11-17-at-13.10.24.png|center|300px|thumb
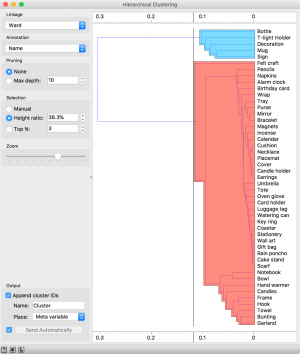
Finally, we observe the discovered clusters in Hierarchical Clustering. Seems like mugs and decorative signs are frequently bought together. Why so? Select the group in Hierarchical Clustering and observe the cluster in a Data Table. Consider this an exercise in data exploration. :)
The second workshop was our standard Introduction to Data Mining for Ministry of Public Affairs.
This group, similar to the one from India, was a pack of curious individuals who asked many interesting questions and were not shy to challenge us. How does a Tree know which attribute to split by? Is Tree better than Naive Bayes? Or is perhaps Logistic Regression better? How do we know which model works best? And finally, what is the mean of sauerkraut and beans? It has to be jota!
Workshops are always fun, when you have a curious set of individuals who demand answers! :)


