Difference between revisions of "Orange: Color"
Onnowpurbo (talk | contribs) (Created page with "Sumber: https://docs.biolab.si//3/visual-programming/widgets/data/color.html Set color legend for variables. Inputs Data: input data set Outputs Data: data set wi...") |
Onnowpurbo (talk | contribs) (→Contoh) |
||
| (7 intermediate revisions by the same user not shown) | |||
| Line 1: | Line 1: | ||
Sumber: https://docs.biolab.si//3/visual-programming/widgets/data/color.html | Sumber: https://docs.biolab.si//3/visual-programming/widgets/data/color.html | ||
| − | + | Widget Color men-set color legend untuk variabel. | |
| − | |||
| − | |||
| − | |||
| − | |||
| − | |||
| − | |||
| − | |||
| − | |||
| − | |||
| − | |||
| − | |||
| − | |||
| − | |||
| − | |||
| − | |||
| − | |||
| − | |||
| − | |||
| − | |||
| − | |||
| − | |||
| − | |||
| − | |||
| − | |||
| − | |||
| − | |||
| − | |||
| − | |||
| − | |||
| − | |||
| − | |||
| − | |||
| − | |||
| − | |||
| − | |||
| − | |||
| − | |||
| − | |||
| − | |||
| − | |||
| − | |||
| − | |||
| − | |||
| − | |||
| − | |||
| − | |||
| − | |||
| − | |||
| − | |||
| − | |||
| − | |||
| − | |||
| − | |||
| − | |||
| − | |||
| − | |||
| − | |||
| − | |||
| − | |||
| − | |||
| − | |||
| − | |||
| − | |||
| − | |||
| − | |||
| − | |||
| − | |||
| − | |||
| − | |||
| − | |||
| − | |||
| − | |||
| − | |||
| − | |||
| − | |||
| − | |||
| − | |||
| − | |||
| − | |||
| − | |||
| − | |||
| + | ==Input== | ||
| + | Data: input data set | ||
| + | ==Output== | ||
| + | Data: data set with a new color legend | ||
| + | Widget Color memungkinkan kita untuk mengatur color legend dalam visualisasi kita sesuai dengan preferensi kita sendiri. Opsi ini memberi kita tool untuk menekankan hasil dan menawarkan beragam pilihan warna untuk menyajikan data kita. Dapat dikombinasikan dengan sebagian besar widget visualisasi. | ||
| + | [[File:Color-stamped.png|center|200px|thumb]] | ||
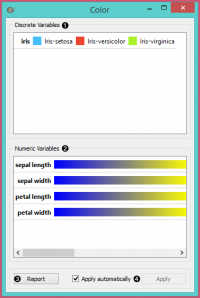
| + | * A list of discrete variables. You can set the color of each variable by double-clicking on it and opening the Color palette or the Select color window. The widget also enables text-editing. By clicking on a variable, you can change its name. | ||
| + | * A list of continuous variables. You can customize the color gradients by double-clicking on them. The widget also enables text-editing. By clicking on a variable, you can change its name. If you hover over the right side side of the gradient, Copy to all appears. You can then apply your customized color gradient to all variables. | ||
| + | * Produce a report. | ||
| + | * Apply changes. If Apply automatically is ticked, changes will be communicated automatically. Alternatively, just click Apply. | ||
| + | ===Discrete variables=== | ||
| + | [[File:Color-palette-discrete-stamped.png|center|200px|thumb]] | ||
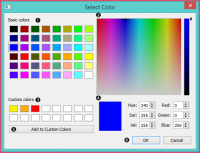
| + | * Choose a desired color from the palette of basic colors. | ||
| + | * Move the cursor to choose a custom color from the color palette. | ||
| + | * Choose a custom color from your previously saved color choices. | ||
| + | * Specify the custom color by: | ||
| + | ** entering the red, green, and blue components of the color as values between 0 (darkest) and 255 (brightest) | ||
| + | ** entering the hue, saturation and luminescence components of the color as values in the range 0 to 255 | ||
| + | * Add the created color to your custom colors. | ||
| + | * Click OK to save your choices or Cancel to exit the the color palette. | ||
| + | ===Numeric variables=== | ||
| + | [[File:Color-palette-numeric-stamped.png|center|200px|thumb]] | ||
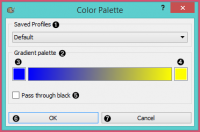
| + | * Choose a gradient from your saved profiles. The default profile is already set. | ||
| + | * The gradient palette | ||
| + | * Select the left side of the gradient. Double clicking the color opens the Select Color window. | ||
| + | * Select the right side of the gradient. Double clicking the color opens the Select Color window. | ||
| + | * Pass through black. | ||
| + | * Click OK to save your choices or Cancel to exit the color palette. | ||
| + | ==Contoh== | ||
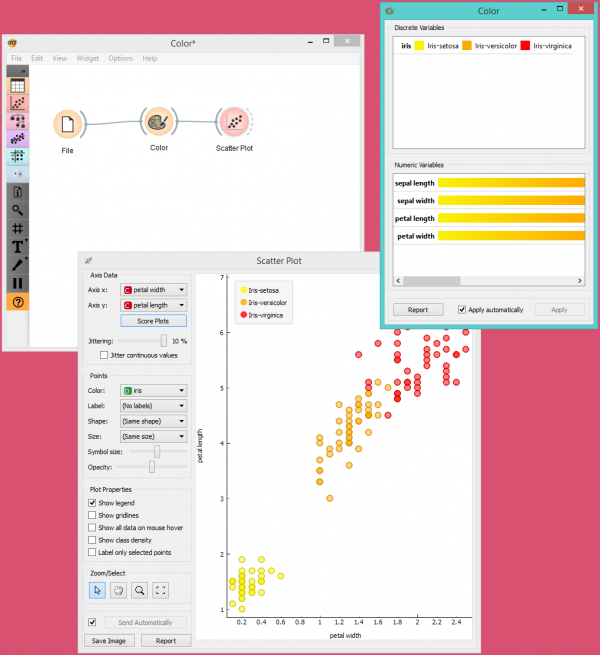
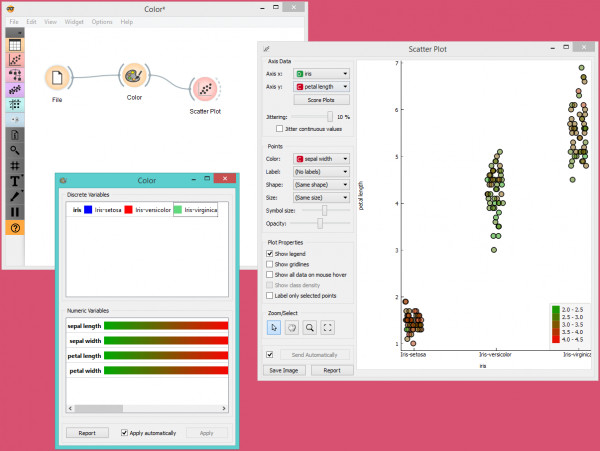
| + | Kita memilih untuk bekerja dengan set data Iris. Kita membuka widget Color dan memilih tiga warna baru untuk tiga jenis Iris. Kemudian kita membuka widget Scatter Plot dan melihat perubahan yang dilakukan pada widget Scatter Plot. | ||
| + | [[File:Color-Example-1.png|center|600px|thumb]] | ||
| + | Pada contoh berikut ini, kita ingin menunjukkan penggunaan widget Color dengan variabel kontinu. Kita menempatkan berbagai jenis Iris pada sumbu x dan panjang kelopak pada sumbu y. Kita menciptakan gradien warna baru dan menamakannya greed (green + red). Untuk menunjukkan bahwa panjang sepal bukan merupakan faktor penentu dalam membedakan antara berbagai jenis Iris, kita memilih untuk mewarnai titik sesuai dengan lebar sepal. | ||
| + | [[File:Color-Example-2.png|center|600px|thumb]] | ||
==Referensi== | ==Referensi== | ||
Latest revision as of 10:48, 20 April 2020
Sumber: https://docs.biolab.si//3/visual-programming/widgets/data/color.html
Widget Color men-set color legend untuk variabel.
Input
Data: input data set
Output
Data: data set with a new color legend
Widget Color memungkinkan kita untuk mengatur color legend dalam visualisasi kita sesuai dengan preferensi kita sendiri. Opsi ini memberi kita tool untuk menekankan hasil dan menawarkan beragam pilihan warna untuk menyajikan data kita. Dapat dikombinasikan dengan sebagian besar widget visualisasi.
- A list of discrete variables. You can set the color of each variable by double-clicking on it and opening the Color palette or the Select color window. The widget also enables text-editing. By clicking on a variable, you can change its name.
- A list of continuous variables. You can customize the color gradients by double-clicking on them. The widget also enables text-editing. By clicking on a variable, you can change its name. If you hover over the right side side of the gradient, Copy to all appears. You can then apply your customized color gradient to all variables.
- Produce a report.
- Apply changes. If Apply automatically is ticked, changes will be communicated automatically. Alternatively, just click Apply.
Discrete variables
- Choose a desired color from the palette of basic colors.
- Move the cursor to choose a custom color from the color palette.
- Choose a custom color from your previously saved color choices.
- Specify the custom color by:
- entering the red, green, and blue components of the color as values between 0 (darkest) and 255 (brightest)
- entering the hue, saturation and luminescence components of the color as values in the range 0 to 255
- Add the created color to your custom colors.
- Click OK to save your choices or Cancel to exit the the color palette.
Numeric variables
- Choose a gradient from your saved profiles. The default profile is already set.
- The gradient palette
- Select the left side of the gradient. Double clicking the color opens the Select Color window.
- Select the right side of the gradient. Double clicking the color opens the Select Color window.
- Pass through black.
- Click OK to save your choices or Cancel to exit the color palette.
Contoh
Kita memilih untuk bekerja dengan set data Iris. Kita membuka widget Color dan memilih tiga warna baru untuk tiga jenis Iris. Kemudian kita membuka widget Scatter Plot dan melihat perubahan yang dilakukan pada widget Scatter Plot.
Pada contoh berikut ini, kita ingin menunjukkan penggunaan widget Color dengan variabel kontinu. Kita menempatkan berbagai jenis Iris pada sumbu x dan panjang kelopak pada sumbu y. Kita menciptakan gradien warna baru dan menamakannya greed (green + red). Untuk menunjukkan bahwa panjang sepal bukan merupakan faktor penentu dalam membedakan antara berbagai jenis Iris, kita memilih untuk mewarnai titik sesuai dengan lebar sepal.
