Orange: Image Analytics Clustering
Sumber: https://orange.biolab.si/blog/2017/04/03/image-analytics-clustering/
Data tidak selalu datang dalam bentuk tabel yang bagus. Data juga dapat berupa kumpulan teks, rekaman audio, materi video atau bahkan gambar. Namun, komputer hanya dapat bekerja dengan angka, jadi untuk setiap penambangan data, kita perlu mengubah data yang tidak terstruktur tersebut menjadi representasi vektor.
Untuk mengambil angka dari data yang tidak terstruktur, Orange dapat menggunakan deep network embedder. Kita baru saja mulai memasukkan berbagai embedders di Orange, dan untuk saat ini, mereka tersedia untuk teks dan gambar.
Terkait: Video pada image clustering
Di sini, kami memberikan contoh image embedding dan menunjukkan betapa mudahnya menggunakannya di Orange. Secara teknis, Orange akan mengirim gambar ke server, di mana server akan mendorong gambar melalui pre-trained deep neural network, seperti Google Inception v3. Deep network sering dilatih dengan tujuan khusus. Inception v3, misalnya, dapat mengklasifikasikan gambar ke dalam salah satu dari 1.000 kelas gambar. Kita dapat mengabaikan klasifikasi, sebagai gantinya mempertimbangkan lapisan kedua dari belakang jaringan dengan 2048 node (angka) dan menggunakannya untuk image’s vector-based representation.
Contoh
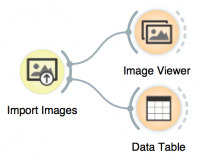
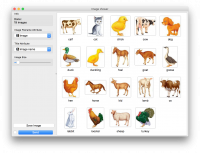
Di sini kita memiliki 19 gambar hewan peliharaan. Pertama, unduh gambar dan unzip. Kemudian gunakanImport Images widget dari add-on Orange's Image Analytics dan buka direktori yang berisi gambar.
Kami dapat memvisualisasikan gambar dalam Image Viewer widget. Inilah workflow kami sejauh ini, dengan gambar yang ditampilkan di Image Viewer:
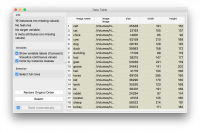
But what do we see in a data table? Only some useless description of images (file name, the location of the file, its size, and the image width and height).
This cannot help us with machine learning. As I said before, we need numbers. To acquire numerical representation of these images, we will send the images to Image Embedding widget.
Great! Now we have the numbers we wanted. There are 2048 of them (columns n0 to n2047). From now on, we can apply all the standard machine learning techniques, say, clustering.
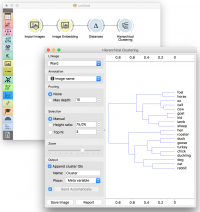
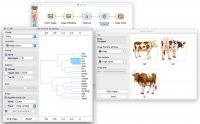
Let us measure the distance between these images and see which are the most similar. We used Distances widget to measure the distance. Normally, cosine distance works best for images, but you can experiment on your own. Then we passed the distance matrix to Hierarchical Clustering to visualize similar pairs in a dendrogram.
This looks very promising! All the right animals are grouped together. But I can’t see the results so well in the dendrogram. I want to see the images - with Image Viewer!
So cool! All the cow family is grouped together! Now we can click on different branches of the dendrogram and observe which animals belong to which group.
But I know what you are going to say. You are going to say I am cheating. That I intentionally selected similar images to trick you.
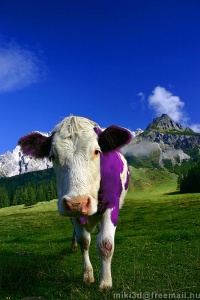
I will prove you wrong. I will take a new cow, say, the most famous cow in Europe - Milka cow.
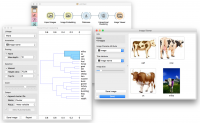
This image is quite different from the other images - it doesn’t have a white background, it’s a real (yet photoshopped) photo and the cow is facing us. Will the Image Embedding find the right numerical representation for this cow?
Indeed it has. Milka is nicely put together with all the other cows.
Image analytics is such an exciting field in machine learning and now Orange is a part of it too! You need to install the Image Analytics add on and you are all set for your research!

