Orange: Tree Viewer
Sumber: https://docs.biolab.si//3/visual-programming/widgets/visualize/treeviewer.html
Widget Tree Viewer mem-visualiasi classification tree dan regression tree.
Input
Tree: decision tree
Output
Selected Data: instances selected from the tree node
Data: data with an additional column showing whether a point is selected
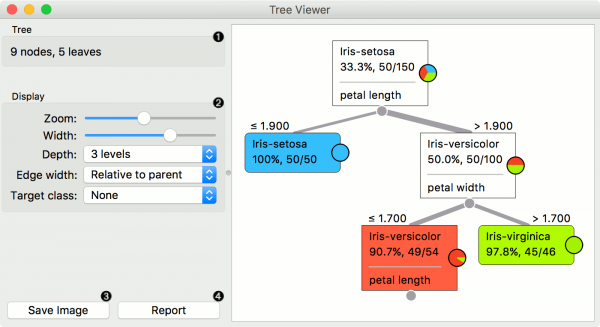
Widget Tree Viewer adalah widget serbaguna dengan visualisasi 2-D classification tree and regression tree. Pengguna dapat memilih node, menginstruksikan widget untuk menampilkan data yang terkait dengan node, sehingga memungkinkan analisis data eksploratif.
- Information on the input.
- Display options:
- Zoom in and zoom out
- Select the tree width. The nodes display information bubbles when hovering over them.
- Select the depth of your tree.
- Select edge width. The edges between the nodes in the tree graph are drawn based on the selected edge width.
- All the edges will be of equal width if Fixed is chosen.
- When Relative to root is selected, the width of the edge will correspond to the proportion of instances in the corresponding node with respect to all the instances in the training data. Under this selection, the edge will get thinner and thinner when traversing toward the bottom of the tree.
- Relative to parent makes the edge width correspond to the proportion of instances in the nodes with respect to the instances in their parent node.
- Define the target class, which you can change based on classes in the data.
- Press Save image to save the created tree graph to your computer as a .svg or .png file.
- Produce a report.
Contoh
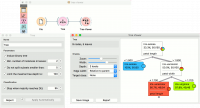
Di bawah ini adalah workflow klasifikasi sederhana, data di load menggunakan widget File. Decision Tree dibuat menggunakan widget Tree dan kemudian di lihat menggunakan widget Tree Viewer. Jika ke dua widget Tree Viewer dan widget Tree dibuka bersamaan, re-run tree induction algorithm akan secara langsung berdampak pada visualisasi. Oleh karenanya, kita dapat menggunakan workflow ini untuk meng-explorasi bagaimana parameter dari tree induction algorithm mempengaruhi tree yang di hasilkan.
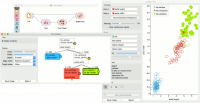
Mengklik pada sembarang node akan menampilkan instance data terkait. Ini dieksplorasi dalam workflow di bawah ini yang menunjukkan subset di widget Data Table dan di widget Scatter Plot. Pastikan bahwa data tree dilewatkan sebagai subset data; ini dapat dilakukan dengan menghubungkan widget Scatter Plot ke widget File terlebih dahulu, dan selanjutnya dihubungkan ke widget Tree Viewer. Data yang dipilih akan ditampilkan sebagai dot bold.
Tree Viewer can also export labeled data. Connect Data Table to Tree Viewer and set the link between widgets to Data instead of Selected Data. This will send the entire data to Data Table with an additional meta column labeling selected data instances (Yes for selected and No for the remaining).
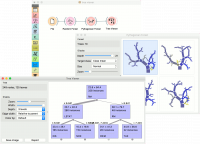
Finally, Tree Viewer can be used also for visualizing regression trees. Connect Random Forest to File widget using housing.tab dataset. Then connect Pythagorean Forest to Random Forest. In Pythagorean Forest select a regression tree you wish to further analyze and pass it to the Tree Viewer. The widget will display the constructed tree. For visualizing larger trees, especially for regression, Pythagorean Tree could be a better option.


