Orange: Image Grid
Sumber: https://orange.biolab.si/widget-catalog/image-analytics/imagegrid/
Displays images in a similarity grid.
Inputs
   Embeddings: Image embeddings from Image Embedding widget.
   Data Subset: A subset of embeddings or images.
Outputs
   Images: Images from the dataset with an additional column specifying if the image is selected or the group, if there are several.
   Selected Images: Selected images with an additional column specifying the group.
The Image Grid widget can display images from a dataset in a similarity grid - images with similar content are placed closer to each other. It can be used for image comparison, while looking for similarities or discrepancies between selected data instances (e.g. bacterial growth or bitmap representations of handwriting).
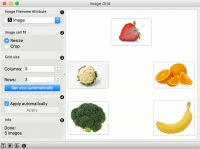
   Image Filename Attribute: Attribute containing paths to images.
   Image cell fit: Resize scales the images to grid, while Crop crops them to squares.
   Grid size: Set the size of the grid. Click Set size automatically to optimize the projection.
   Tick the box to commit the changes automatically. Alternatively, click Apply.
   Information on the input.
   Access help, save image, and report (in that order).
Contoh
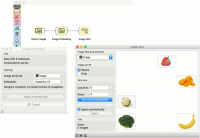
Image Grid can be used to visualize similarity of images in a 2D projection. We have used 5 images of fruits and vegetables, namely orange, banana, strawberry, broccoli and cauliflower.
We loaded the images with Import Images and embedded them with Inception v3 embedder in Image Embedding.
Finally, we visualized the images in Image Grid. It is obvious that broccoli and cauliflower and much more alike than strawberry and banana.

