Difference between revisions of "Orange: Radviz"
Onnowpurbo (talk | contribs) |
Onnowpurbo (talk | contribs) (→Output) |
||
| Line 14: | Line 14: | ||
Components: Radviz vectors | Components: Radviz vectors | ||
| − | Radviz (Hoffman et al. 1997) | + | Radviz (Hoffman et al. 1997) adalah teknik visualisasi multi-dimensi non-linear yang dapat menampilkan data yang didefinisikan oleh tiga variabel atau lebih dalam proyeksi 2 dimensi. Variabel yang divisualisasikan disajikan sebagai titik anchor (jangkar) dengan jarak yang sama di sekitar keliling unit lingkaran. Contoh data ditampilkan sebagai titik di dalam lingkaran, dengan posisi mereka ditentukan oleh metafora dari fisika: setiap titik dipegang di tempat dengan pegas yang terpasang di ujung lain ke variabel anchor (jangkar). Kekakuan masing-masing pegas sebanding dengan nilai variabel yang sesuai dan titik berakhir pada posisi di mana gaya pegas berada dalam kesetimbangan. Sebelum visualisasi, nilai-nilai variabel diskalakan untuk berada di antara 0 dan 1. Data instance yang dekat dengan serangkaian variabel anchor (jangkar) memiliki nilai lebih tinggi untuk variabel-variabel ini daripada yang lain. |
The snapshot shown below shows a Radviz widget with a visualization of the dataset from functional genomics (Brown et al. 2000). In this particular visualization the data instances are colored according to the corresponding class, and the visualization space is colored according to the computed class probability. Notice that the particular visualization very nicely separates data instances of different class, making the visualization interesting and potentially informative. | The snapshot shown below shows a Radviz widget with a visualization of the dataset from functional genomics (Brown et al. 2000). In this particular visualization the data instances are colored according to the corresponding class, and the visualization space is colored according to the computed class probability. Notice that the particular visualization very nicely separates data instances of different class, making the visualization interesting and potentially informative. | ||
| Line 23: | Line 23: | ||
[[File:Radviz-Brown-2.png|center|600px|thumb]] | [[File:Radviz-Brown-2.png|center|600px|thumb]] | ||
| − | |||
==Referensi== | ==Referensi== | ||
Revision as of 06:50, 11 April 2020
Sumber: https://docs.biolab.si//3/visual-programming/widgets/visualize/radviz.html
Widget Radviz mem-visualisasi dengan explorative data analysis dan intelligent data visualization enhancement.
Input
Data: input dataset
Data Subset: subset of instances
Output
Selected Data: instances selected from the plot
Data: data with an additional column showing whether a point is selected
Components: Radviz vectors
Radviz (Hoffman et al. 1997) adalah teknik visualisasi multi-dimensi non-linear yang dapat menampilkan data yang didefinisikan oleh tiga variabel atau lebih dalam proyeksi 2 dimensi. Variabel yang divisualisasikan disajikan sebagai titik anchor (jangkar) dengan jarak yang sama di sekitar keliling unit lingkaran. Contoh data ditampilkan sebagai titik di dalam lingkaran, dengan posisi mereka ditentukan oleh metafora dari fisika: setiap titik dipegang di tempat dengan pegas yang terpasang di ujung lain ke variabel anchor (jangkar). Kekakuan masing-masing pegas sebanding dengan nilai variabel yang sesuai dan titik berakhir pada posisi di mana gaya pegas berada dalam kesetimbangan. Sebelum visualisasi, nilai-nilai variabel diskalakan untuk berada di antara 0 dan 1. Data instance yang dekat dengan serangkaian variabel anchor (jangkar) memiliki nilai lebih tinggi untuk variabel-variabel ini daripada yang lain.
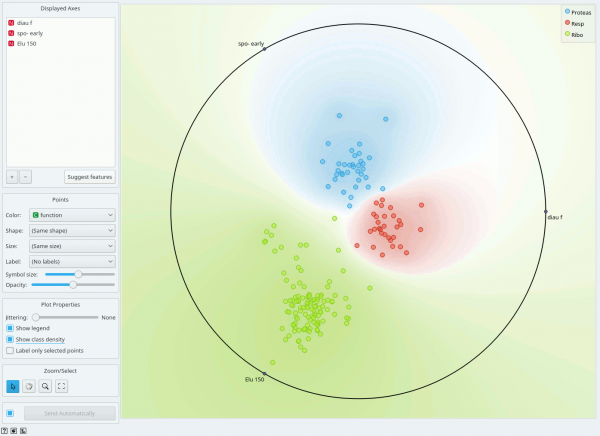
The snapshot shown below shows a Radviz widget with a visualization of the dataset from functional genomics (Brown et al. 2000). In this particular visualization the data instances are colored according to the corresponding class, and the visualization space is colored according to the computed class probability. Notice that the particular visualization very nicely separates data instances of different class, making the visualization interesting and potentially informative.
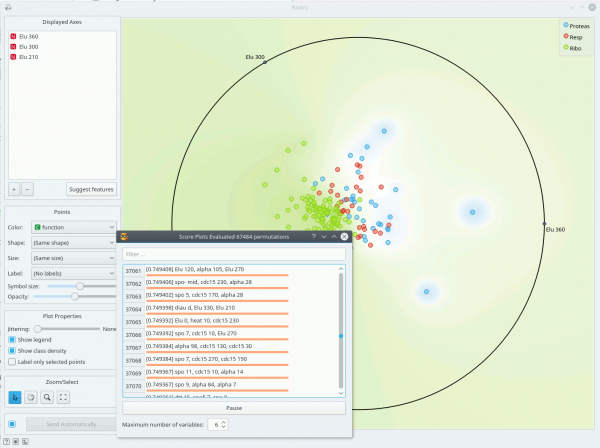
Just like all point-based visualizations, this widget includes tools for intelligent data visualization (VizRank, see Leban et al. 2006) and an interface for explorative data analysis - selection of data points in visualization. Just like the Scatter Plot widget, it can be used to find a set of variables that would result in an interesting visualization. The Radviz graph above is according to this definition an example of a very good visualization, while the one below - where we show an VizRank’s interface (Suggest features button) with a list of 3-attribute visualizations and their scores - is not.
Referensi
Hoffman, P. E. et al. (1997) DNA visual and analytic data mining. In the Proceedings of the IEEE Visualization. Phoenix, AZ, pp. 437-441.
Brown, M. P., W. N. Grundy et al. (2000). “Knowledge-based analysis of microarray gene expression data by using support vector machines.” Proc Natl Acad Sci U S A 97(1): 262-7.
Leban, G., B. Zupan et al. (2006)

