Difference between revisions of "Orange: Distance Map"
Onnowpurbo (talk | contribs) |
Onnowpurbo (talk | contribs) |
||
| Line 3: | Line 3: | ||
| − | + | Visualisasi distances antar items. | |
==Input== | ==Input== | ||
| Line 14: | Line 14: | ||
Features: attributes selected from the matrix | Features: attributes selected from the matrix | ||
| − | + | Distance Map memvisualisasikan jarak attar objek. Visualisasinya sama seperti jika kita mencetak tabel angka, bedanya angka-angka tersebut diganti dengan bintik-bintik berwarna. | |
| − | Distances | + | Distances paling sering adalah di antara instance ("baris" di widget Distances) atau atribut ("kolom" di widget Distances). Satu-satunya input yang cocok untuk Distance Map adalah widget Distances. Untuk output, pengguna dapat memilih wilayah peta dan widget akan menampilkan instance atau atribut yang sesuai. Juga perhatikan bahwa widget Distances mengabaikan nilai diskrit dan menghitung jarak hanya untuk data kontinu, sehingga widget hanya dapat menampilkan peta jarak untuk distance map jika anda membuatnya kontinyu terlebih dahulu. |
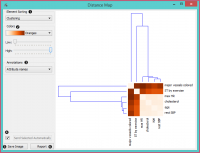
| − | + | Snapshot ini menunjukkan jarak antar kolom dalam data pheart disease, di mana jarak yang lebih kecil diwakili dengan light dan larger oranye gelap. Matrix simetris dan diagonal adalah warna oranye terang - tidak ada atribut yang berbeda dari dirinya sendiri. Simetrisitas selalu diasumsikan, sedangkan diagonal mungkin juga bukan nol. | |
[[File:DistanceMap-stamped.png|center|200px|thumb]] | [[File:DistanceMap-stamped.png|center|200px|thumb]] | ||
Revision as of 06:29, 23 February 2020
Sumber: https://docs.biolab.si//3/visual-programming/widgets/unsupervised/distancemap.html
Visualisasi distances antar items.
Input
Distances: distance matrix
Output
Data: instances selected from the matrix
Features: attributes selected from the matrix
Distance Map memvisualisasikan jarak attar objek. Visualisasinya sama seperti jika kita mencetak tabel angka, bedanya angka-angka tersebut diganti dengan bintik-bintik berwarna.
Distances paling sering adalah di antara instance ("baris" di widget Distances) atau atribut ("kolom" di widget Distances). Satu-satunya input yang cocok untuk Distance Map adalah widget Distances. Untuk output, pengguna dapat memilih wilayah peta dan widget akan menampilkan instance atau atribut yang sesuai. Juga perhatikan bahwa widget Distances mengabaikan nilai diskrit dan menghitung jarak hanya untuk data kontinu, sehingga widget hanya dapat menampilkan peta jarak untuk distance map jika anda membuatnya kontinyu terlebih dahulu.
Snapshot ini menunjukkan jarak antar kolom dalam data pheart disease, di mana jarak yang lebih kecil diwakili dengan light dan larger oranye gelap. Matrix simetris dan diagonal adalah warna oranye terang - tidak ada atribut yang berbeda dari dirinya sendiri. Simetrisitas selalu diasumsikan, sedangkan diagonal mungkin juga bukan nol.
- Element sorting arranges elements in the map by
- None (lists instances as found in the dataset)
- Clustering (clusters data by similarity)
- Clustering with ordered leaves (maximizes the sum of similarities of adjacent elements)
- Colors
- Colors (select the color palette for your distance map)
- Low and High are thresholds for the color palette (low for instances or attributes with low distances and high for instances or attributes with high distances).
- Select Annotations.
- If Send Selected Automatically is on, the data subset is communicated automatically, otherwise you need to press Send Selected.
- Press Save Image if you want to save the created image to your computer.
- Produce a report.
Normally, a color palette is used to visualize the entire range of distances appearing in the matrix. This can be changed by setting the low and high threshold. In this way we ignore the differences in distances outside this interval and visualize the interesting part of the distribution.
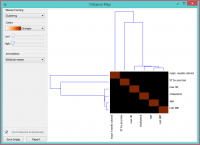
Below, we visualized the most correlated attributes (distances by columns) in the heart disease dataset by setting the color threshold for high distances to the minimum. We get a predominantly black square, where attributes with the lowest distance scores are represented by a lighter shade of the selected color schema (in our case: orange). Beside the diagonal line, we see that in our example ST by exercise and major vessels colored are the two attributes closest together.
The user can select a region in the map with the usual click-and-drag of the cursor. When a part of the map is selected, the widget outputs all items from the selected cells.
Contoh
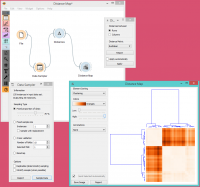
The first workflow shows a very standard use of the Distance Map widget. We select 70% of the original Iris data as our sample and view the distances between rows in Distance Map.
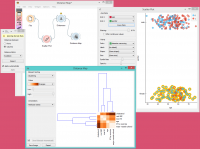
In the second example, we use the heart disease data again and select a subset of women only from the Scatter Plot. Then, we visualize distances between columns in the Distance Map. Since the subset also contains some discrete data, the Distances widget warns us it will ignore the discrete features, thus we will see only continuous instances/attributes in the map.


