Difference between revisions of "Orange: VAR Model"
Jump to navigation
Jump to search
Onnowpurbo (talk | contribs) (Created page with "Sumber: https://orange.biolab.si/widget-catalog/time-series/var/ Model the time series using vector autoregression (VAR) model. Inputs Time series: Time series as outp...") |
Onnowpurbo (talk | contribs) |
||
| Line 16: | Line 16: | ||
Using this widget, you can model the time series using VAR model. | Using this widget, you can model the time series using VAR model. | ||
| + | |||
| + | [[File:Var-model-stamped.png|center|200px|thumb]] | ||
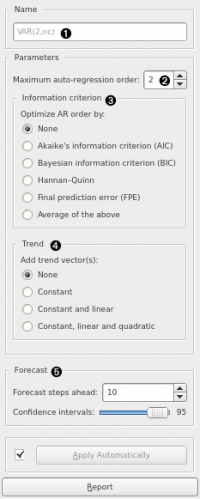
Model’s name. By default, the name is derived from the model and its parameters. | Model’s name. By default, the name is derived from the model and its parameters. | ||
| Line 26: | Line 28: | ||
Number of forecast steps the model should output, along with the desired confidence intervals values at each step. | Number of forecast steps the model should output, along with the desired confidence intervals values at each step. | ||
| − | + | ==Contoh== | |
| + | |||
| + | [[File:Line-chart-ex1.png|center|200px|thumb]] | ||
| − | See also | + | ==See also== |
ARIMA Model, Model Evaluation | ARIMA Model, Model Evaluation | ||
Revision as of 18:52, 26 January 2020
Sumber: https://orange.biolab.si/widget-catalog/time-series/var/
Model the time series using vector autoregression (VAR) model.
Inputs
Time series: Time series as output by As Timeseries widget.
Outputs
   Time series model: The VAR model fitted to input time series.
   Forecast: The forecast time series.
   Fitted values: The values that the model was actually fitted to, equals to original values - residuals.
   Residuals: The errors the model made at each step.
Using this widget, you can model the time series using VAR model.
   Model’s name. By default, the name is derived from the model and its parameters.
   Desired model order (number of parameters).
   If other than None, optimize the number of model parameters (up to the value selected in (2)) with the selected information criterion (one of: AIC, BIC, HQIC, FPE, or a mix thereof).
   Choose this option to add additional “trend” columns to the data:
       Constant: a single column of ones is added
       Constant and linear: a column of ones and a column of linearly increasing numbers are added
       Constant, linear and quadratic: an additional column of quadratics is added
   Number of forecast steps the model should output, along with the desired confidence intervals values at each step.
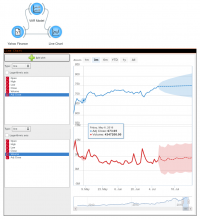
Contoh
See also
ARIMA Model, Model Evaluation

