Difference between revisions of "Orange: Yahoo Finance"
Jump to navigation
Jump to search
Onnowpurbo (talk | contribs) (Created page with "Sumber: https://orange.biolab.si/widget-catalog/time-series/yahoo_finance/ Generate time series from Yahoo Finance stock market data. Outputs Time series: Time series t...") |
Onnowpurbo (talk | contribs) |
||
| Line 8: | Line 8: | ||
This widget fetches historical stock market data from Yahoo Finance and outputs it as a time series data table. | This widget fetches historical stock market data from Yahoo Finance and outputs it as a time series data table. | ||
| + | |||
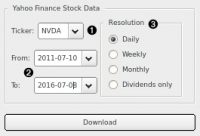
| + | [[File:Yahoo-finance-stamped.png|center|200px|thumb]] | ||
Stock (e.g. GOOG) or index (e.g. DJI) symbol you are interested in. | Stock (e.g. GOOG) or index (e.g. DJI) symbol you are interested in. | ||
| Line 13: | Line 15: | ||
Desired resolution of the time series. Can be one of: daily, weekly, monthly, or dividends. The last option outputs a table of dates when dividends were issued, along with their respective dividend amounts. | Desired resolution of the time series. Can be one of: daily, weekly, monthly, or dividends. The last option outputs a table of dates when dividends were issued, along with their respective dividend amounts. | ||
| − | + | ==Contoh== | |
Since the output data type is inherently a Table, you can connect it to wherever a data table is expected. Naturally, you can use it to test some functions in the Timeseries add-on. | Since the output data type is inherently a Table, you can connect it to wherever a data table is expected. Naturally, you can use it to test some functions in the Timeseries add-on. | ||
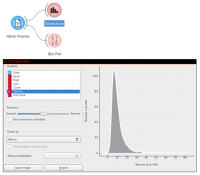
| + | [[File:Yahoo-finance-ex1.png|center|200px|thumb]] | ||
Revision as of 12:32, 25 January 2020
Sumber: https://orange.biolab.si/widget-catalog/time-series/yahoo_finance/
Generate time series from Yahoo Finance stock market data.
Outputs
Time series: Time series table of open, high, low, close (OHLC) prices, volume and adjusted close price.
This widget fetches historical stock market data from Yahoo Finance and outputs it as a time series data table.
   Stock (e.g. GOOG) or index (e.g. DJI) symbol you are interested in.
   Date range you are interested in.
   Desired resolution of the time series. Can be one of: daily, weekly, monthly, or dividends. The last option outputs a table of dates when dividends were issued, along with their respective dividend amounts.
Contoh
Since the output data type is inherently a Table, you can connect it to wherever a data table is expected. Naturally, you can use it to test some functions in the Timeseries add-on.

