Difference between revisions of "Orange: Mosaic Display"
Onnowpurbo (talk | contribs) (→Contoh) |
Onnowpurbo (talk | contribs) |
||
| Line 1: | Line 1: | ||
Sumber: https://docs.biolab.si//3/visual-programming/widgets/visualize/mosaicdisplay.html | Sumber: https://docs.biolab.si//3/visual-programming/widgets/visualize/mosaicdisplay.html | ||
| − | Display data | + | Widget Mosaic Display dapat menampilkan data dalam mosaic plot. |
==Input== | ==Input== | ||
| Line 12: | Line 12: | ||
Selected data: instances selected from the plot | Selected data: instances selected from the plot | ||
| − | + | Mosaic plot adalah representasi grafis dari tabel frekuensi dua-arah atau tabel contingency. Mosaic Plot digunakan untuk mem-visualisasi data dari dua atau lebih variabel kualitatif dan pertama kali di perkenalkan tahun 1981 oleh Hartigan dan Kleiner yang kemudian di kembangkan dan di perbaiki oleh Friendly tahun 1994. Mosaic Plot memberi pengguna sarana untuk mengenali hubungan antara berbagai variabel secara lebih efisien. | |
[[File:Mosaic-Display-stamped.png|center|200px|thumb]] | [[File:Mosaic-Display-stamped.png|center|200px|thumb]] | ||
| Line 23: | Line 23: | ||
==Contoh== | ==Contoh== | ||
| − | + | Kita load titanic dataset melalui widget File dan menghubungkannya ke widget Mosaic Display. Kita putuskan untuk memfokuskan pada dua variabel, yaitu status, sex dan survival. Kita beri warna (color) interior berdasarkan Pearson residuals untuk menggambarkan perbedaan anda nilai hasil observasi dan nilai fitted. Kita dapat melihat bahwa tingkat survive untuk pria dan wanita jelas menyimpang dari nilai fitted. | |
[[File:Mosaic-Display-Example.png|center|600px|thumb]] | [[File:Mosaic-Display-Example.png|center|600px|thumb]] | ||
| − | |||
| − | |||
==Referensi== | ==Referensi== | ||
Revision as of 11:05, 9 April 2020
Sumber: https://docs.biolab.si//3/visual-programming/widgets/visualize/mosaicdisplay.html
Widget Mosaic Display dapat menampilkan data dalam mosaic plot.
Input
Data: input dataset
Data subset: subset of instances
Output
Selected data: instances selected from the plot
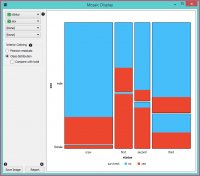
Mosaic plot adalah representasi grafis dari tabel frekuensi dua-arah atau tabel contingency. Mosaic Plot digunakan untuk mem-visualisasi data dari dua atau lebih variabel kualitatif dan pertama kali di perkenalkan tahun 1981 oleh Hartigan dan Kleiner yang kemudian di kembangkan dan di perbaiki oleh Friendly tahun 1994. Mosaic Plot memberi pengguna sarana untuk mengenali hubungan antara berbagai variabel secara lebih efisien.
- Select the variables you wish to see plotted.
- Select interior coloring. You can color the interior according to class or you can use the Pearson residual, which is the difference between observed and fitted values, divided by an estimate of the standard deviation of the observed value. If Compare to total is clicked, a comparison is made to all instances.
- Save image saves the created image to your computer in a .svg or .png format.
- Produce a report.
Contoh
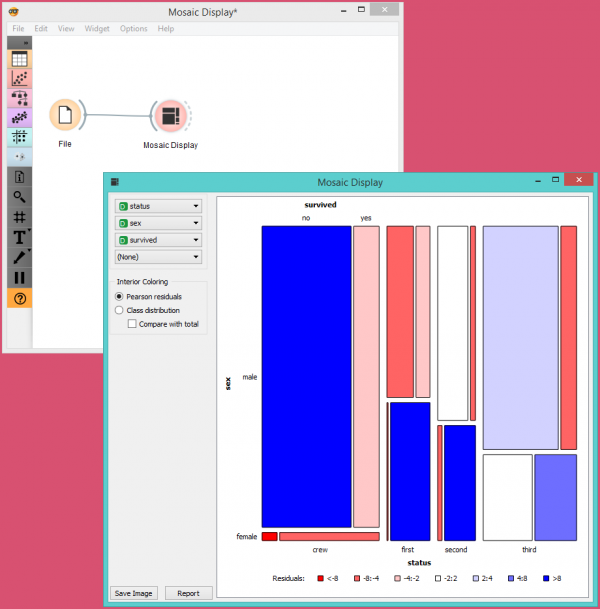
Kita load titanic dataset melalui widget File dan menghubungkannya ke widget Mosaic Display. Kita putuskan untuk memfokuskan pada dua variabel, yaitu status, sex dan survival. Kita beri warna (color) interior berdasarkan Pearson residuals untuk menggambarkan perbedaan anda nilai hasil observasi dan nilai fitted. Kita dapat melihat bahwa tingkat survive untuk pria dan wanita jelas menyimpang dari nilai fitted.

