Difference between revisions of "Orange: Pythagorean Tree"
Onnowpurbo (talk | contribs) |
Onnowpurbo (talk | contribs) (→Contoh) |
||
| Line 43: | Line 43: | ||
Widget Pythagorean Tree bersifat interaktif: klik pada salah satu node (kotak) untuk memilih contoh data pelatihan yang dikaitkan dengan node tersebut. Workflow berikut mengeksplorasi fitur ini. | Widget Pythagorean Tree bersifat interaktif: klik pada salah satu node (kotak) untuk memilih contoh data pelatihan yang dikaitkan dengan node tersebut. Workflow berikut mengeksplorasi fitur ini. | ||
| − | [[File:Pythagorean-Tree-scatterplot-workflow.png|center| | + | [[File:Pythagorean-Tree-scatterplot-workflow.png|center|400px|thumb]] |
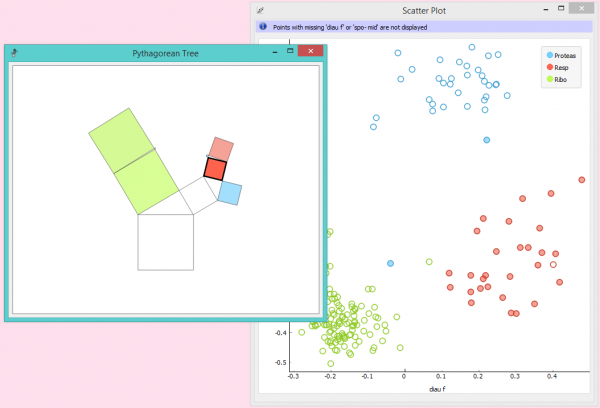
Instance data yang dipilih ditampilkan sebagai subset dalam widget Scatter Plot, dikirim ke widget Data Table dan diperiksa dalam widget Box Plot. Kita telah menggunakan dataset yang dipilih berwarna cokelat dalam contoh ini. Widget Tree dan widget Scatter Plot ditunjukkan di bawah ini; node yang dipilih di tree memiliki garis hitam. | Instance data yang dipilih ditampilkan sebagai subset dalam widget Scatter Plot, dikirim ke widget Data Table dan diperiksa dalam widget Box Plot. Kita telah menggunakan dataset yang dipilih berwarna cokelat dalam contoh ini. Widget Tree dan widget Scatter Plot ditunjukkan di bawah ini; node yang dipilih di tree memiliki garis hitam. | ||
Latest revision as of 11:24, 8 April 2020
Sumber: https://docs.biolab.si//3/visual-programming/widgets/visualize/pythagoreantree.html
Widget Pythagorean Tree dapat mem-visualisasi untuk klasifikasi atau regression tree.
Input
Tree: tree model
Selected Data: instances selected from the tree
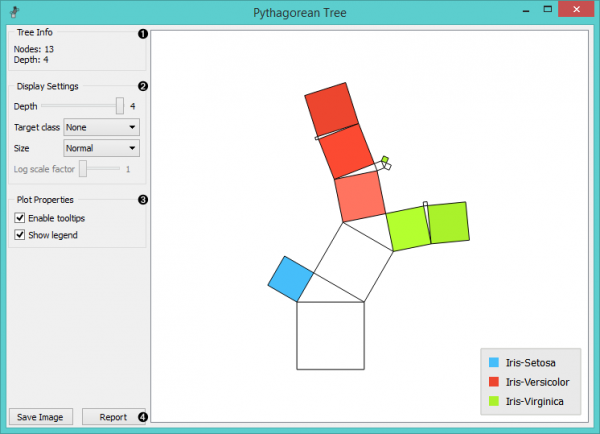
Pythagorean Tree adalah bidang fraktal yang dapat digunakan untuk menggambarkan hierarki tree umum seperti yang disajikan dalam sebuah artikel oleh Fabian Beck dkk. Di Orange, widget Pythagorean Tree digunakan untuk memvisualisasikan dan menjelajahi model tree.
- Information on the input tree model.
- Visualization parameters:
- Depth: set the depth of displayed trees.
- Target class (for classification trees): the intensity of the color for nodes of the tree will correspond to the probability of the target class. If None is selected, the color of the node will denote the most probable class.
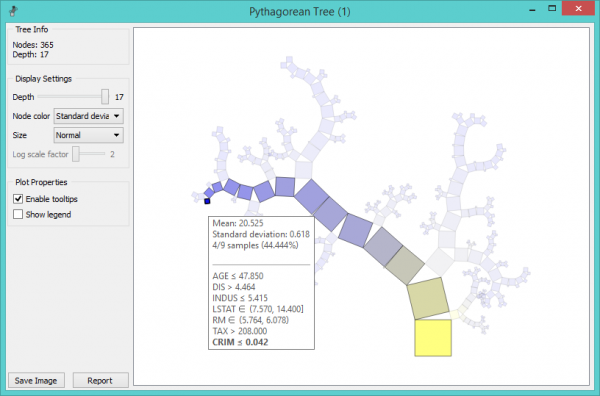
- Node color (for regression trees): node colors can correspond to mean or standard deviation of class value of the training data instances in the node.
- Size: define a method to compute the size of the square representing the node. Normal will keep node sizes correspond to the size of training data subset in the node. Square root and Logarithmic are the respective transformations of the node size.
- Log scale factor is only enabled when logarithmic transformation is selected. You can set the log factor between 1 and 10.
- Plot properties:
- Enable tooltips: display node information upon hovering.
- Show legend: shows color legend for the plot.
- Reporting:
- Save Image: save the visualization to a SVG or PNG file.
- Report: add visualization to the report.
Widget Pythagorean Tree dapat memvisualisasikan classification dan regression tree. Di bawah ini adalah contoh untuk regression tree. Satu-satunya perbedaan antara keduanya adalah bahwa regression tree tidak memungkinkan pewarnaan berdasarkan class, tetapi dapat mewarnai dengan rata-rata class atau standar deviasi.
Contoh
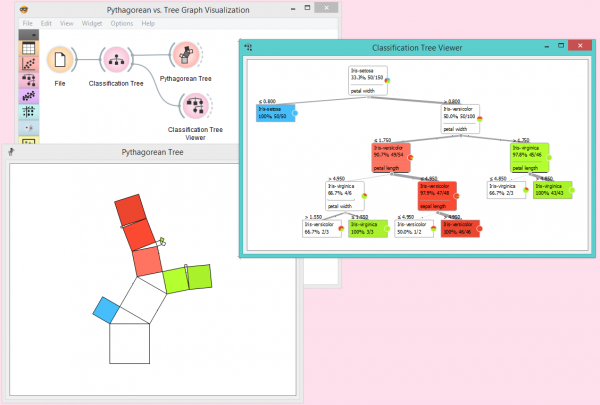
Workflow dari screenshot di bawah ini menunjukkan perbedaan antara widget Tree Viewer and widget Pythagorean Tree. Keduanya dapat memvisualisasikan Tree, tetapi visualisasi widget Pythagorean Tree membutuhkan lebih sedikit ruang dan lebih kompak, bahkan untuk Iris flower dataset yang kecil. Untuk kedua widget visualisasi, kita telah menyembunyikan area kontrol di sebelah kiri dengan mengklik splitter antara area kontrol dan visualisasi.
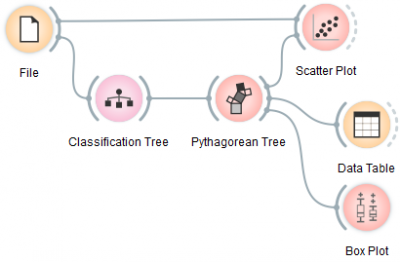
Widget Pythagorean Tree bersifat interaktif: klik pada salah satu node (kotak) untuk memilih contoh data pelatihan yang dikaitkan dengan node tersebut. Workflow berikut mengeksplorasi fitur ini.
Instance data yang dipilih ditampilkan sebagai subset dalam widget Scatter Plot, dikirim ke widget Data Table dan diperiksa dalam widget Box Plot. Kita telah menggunakan dataset yang dipilih berwarna cokelat dalam contoh ini. Widget Tree dan widget Scatter Plot ditunjukkan di bawah ini; node yang dipilih di tree memiliki garis hitam.
Referensi
Beck, F., Burch, M., Munz, T., Di Silvestro, L. and Weiskopf, D. (2014). Generalized Pythagoras Trees for Visualizing Hierarchies. In IVAPP ‘14 Proceedings of the 5th International Conference on Information Visualization Theory and Applications, 17-28.
