Difference between revisions of "Orange: Network Generator"
Jump to navigation
Jump to search
Onnowpurbo (talk | contribs) (→Contoh) |
Onnowpurbo (talk | contribs) (→Contoh) |
||
| Line 31: | Line 31: | ||
==Contoh== | ==Contoh== | ||
| − | Network Generator adalah tool yang baik untuk | + | Network Generator adalah tool yang baik untuk mengexplorasi struktur graph. |
[[File:Network-generator-example.png|center|200px|thumb]] | [[File:Network-generator-example.png|center|200px|thumb]] | ||
Revision as of 11:54, 27 February 2020
Sumber: https://orange.biolab.si/widget-catalog/networks/networkgenerator/
Membuat contoh graph.
Output
Generated Network: An instance of Network Graph.
Network Generator membangun network contoh. Ini dimaksudkan untuk pengajaran / pembelajaran tentang network.
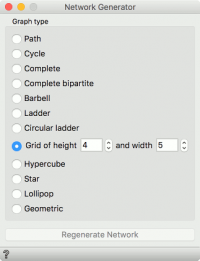
Graph option:
Path: a graph that can be drawn so that all of its vertices and edges lie on a single straight line.
Cycle: a graph that consists of a single cycle, i.e. some number of vertices (at least 3) are connected in a closed chain.
Complete: simple undirected graph in which every pair of distinct vertices is connected by a unique edge.
Complete bipartite: a graph whose vertices can be divided into two disjoint and independent sets.
Barbell: two complete graphs connected by a path.
Ladder: planar undirected graph with 2n vertices and 3n-2 edges.
Circular ladder: Cartesian product of two path graphs.
Grid: a graph whose drawing, embedded in some Euclidean space, forms a regular tiling.
Hypercube: a graph formed from the vertices and edges of an n-dimensional hypercube.
Star: Return the Star graph with n+1 nodes: one center node, connected to n outer nodes.
Lollipop: a complete graph (clique) and a path graph, connected with a bridge.
Geometric: an undirected graph constructed by randomly placing N nodes in some metric space.
Press Regenerate Network untuk mengeluarkan graph instance yang baru.
Contoh
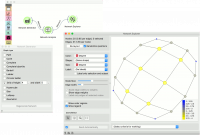
Network Generator adalah tool yang baik untuk mengexplorasi struktur graph.
Di sini, kita membuat graph Grid dengan tinggi 4 dan lebar 5 dan mengirimkannya ke Network Analysis. Kita menghitung derajat simpul dan mengirim data ke Network Explorer. Akhirnya, kita mengamati graph yang dihasilkan dalam visualisasi dan mengatur ukuran dan warna node ke Degree. Ini adalah tool yang bagus untuk mengamati dan menjelaskan sifat-sifat jaringan.

