Difference between revisions of "Orange: Pivot Table"
Onnowpurbo (talk | contribs) |
Onnowpurbo (talk | contribs) |
||
| Line 50: | Line 50: | ||
[[File:Pivot-continuous.png||center|200px|thumb]] | [[File:Pivot-continuous.png||center|200px|thumb]] | ||
| − | + | Contoh tabel pivot dengan variabel numerik. Kita menggunakan heart-disease data set untuk contoh ini. Baris sesuai dengan nilai-nilai variabel penyempitan diameter. Kolom kita adalah nilai-nilai gender, yaitu perempuan dan laki-laki. Kita menggunakan sisa SBP sebagai nilai dalam sel kita. | |
| − | + | Kita memilih Count, Sum and Median sebagai metode agregasi. Di bawah Count, kita melihat ada 72 pasien wanita yang tidak memiliki penyempitan diameter, sama seperti sebelumnya untuk nilai diskrit. Yang berbeda adalah sum dan median agregasi. Kita melihat bahwa jumlah tekanan darah sistolik istirahat untuk pasien wanita yang tidak memiliki penyempitan diameter adalah 9269 dan nilai median adalah 130. | |
==Contoh== | ==Contoh== | ||
Revision as of 07:20, 30 January 2020
Sumber: https://docs.biolab.si//3/visual-programming/widgets/data/pivot.html
Bentuk kembali tabel data berdasarkan nilai kolom.
Input
Data: input data set
Output
Pivot Table: contingency matrix as shown in the widget
Filtered Data: subset selected from the plot
Grouped Data: aggregates over groups defined by row values
Pivot Table merangkum data dari tabel yang lebih luas ke dalam tabel statistik. Statistik dapat mencakup jumlah, rata-rata, jumlah, dll. Widget ini juga memungkinkan pemilihan subset dari tabel dan pengelompokan berdasarkan nilai baris, yang harus berupa variabel diskrit. Data dengan hanya variabel numerik tidak dapat ditampilkan dalam tabel.
- Discrete or numeric variable used for row values. Numeric variables are considered as integers.
- Discrete variable used for column values. Variable values will appear as columns in the table.
- Values used for aggregation. Aggregated values will appear as cells in the table.
- Aggregation methods:
- For any variable type:
- Count: number of instances with the given row and column value.
- Count defined: number of instances where the aggregation value is defined.
- For numeric variables:
- Sum: sum of values.
- Mean: average of values.
- Mode: most frequent value of the subset.
- Min: smallest value.
- Max: highest value.
- Median: middle value.
- Var: variance of the subset.
- For discrete variables:
- Majority: most frequent value of the subset.
- For any variable type:
- Tick the box on the left to automatically output any changes. Alternatively, press Apply .
Variable Diskrit
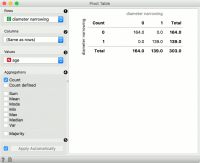
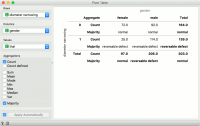
Contoh tabel pivot dengan hanya variabel diskrit yang dipilih. Kita menggunakan heart-disease data set untuk contoh ini. Baris sesuai dengan nilai-nilai variabel penyempitan diameter. Kolom kita adalah nilai-nilai gender, yaitu perempuan dan laki-laki. Kita menggunakan thal sebagai nilai dalam sel kami.
Kita telah memilih Count dan Mayoritas sebagai metode agregasi. Dalam pivot table, kita dapat melihat jumlah instance yang tidak memiliki penyempitan diameter dan wanita. Ada 72 pasien seperti itu. Secara bersamaan, ada 92 pasien pria yang tidak mengalami penyempitan diameter. Nilai Thal tidak berpengaruh di sini, kita hanya menghitung kejadian dalam data.
Baris kedua menunjukkan mayoritas. Ini berarti sebagian besar pasien wanita yang tidak mengalami penyempitan diameter memiliki hasil normal. Sebaliknya, pasien wanita yang mengalami penyempitan diameter paling sering memiliki cacat yang dapat dibalikkan.
Variabel Numerik
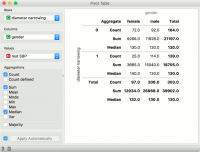
Contoh tabel pivot dengan variabel numerik. Kita menggunakan heart-disease data set untuk contoh ini. Baris sesuai dengan nilai-nilai variabel penyempitan diameter. Kolom kita adalah nilai-nilai gender, yaitu perempuan dan laki-laki. Kita menggunakan sisa SBP sebagai nilai dalam sel kita.
Kita memilih Count, Sum and Median sebagai metode agregasi. Di bawah Count, kita melihat ada 72 pasien wanita yang tidak memiliki penyempitan diameter, sama seperti sebelumnya untuk nilai diskrit. Yang berbeda adalah sum dan median agregasi. Kita melihat bahwa jumlah tekanan darah sistolik istirahat untuk pasien wanita yang tidak memiliki penyempitan diameter adalah 9269 dan nilai median adalah 130.
Contoh
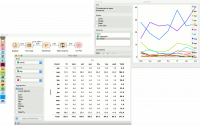
We are using Forest Fires for this example. The data is loaded in the Datasets widget and passed to Pivot Table. Forest Fires datasets reports forest fires by the month and day they happened. We can aggregate all occurrences of forest fires by selecting Count as aggregation method and using month as row and day as column values. Since we are using Count, Values variable will have no effect.
We can plot the counts in Line Plot. But first, let us organize our data a bit. With Edit Domain, we will reorder rows values so that months will appear in the correct order, namely from January to December. To do the same for columns, we will use Select Columns and reorder day to go from Monday to Sunday.
Finally, our data is ready. Let us pass it to Line Plot. We can see that forest fires are most common in August and September, while their frequency is higher during the weekend than during weekdays.


