Difference between revisions of "Orange: Rank"
Onnowpurbo (talk | contribs) |
Onnowpurbo (talk | contribs) |
||
| Line 4: | Line 4: | ||
Ranking of attributes in classification or regression datasets. | Ranking of attributes in classification or regression datasets. | ||
| − | + | ==Input== | |
| − | + | Data: input dataset | |
| + | Scorer: models for feature scoring | ||
| − | + | ==Output== | |
| − | + | Reduced Data: dataset with selected attributes | |
| − | |||
| − | |||
The Rank widget considers class-labeled datasets (classification or regression) and scores the attributes according to their correlation with the class. Rank accepts also models for scoring, such as linear regression, logistic regression, random forest, SGD, etc. | The Rank widget considers class-labeled datasets (classification or regression) and scores the attributes according to their correlation with the class. Rank accepts also models for scoring, such as linear regression, logistic regression, random forest, SGD, etc. | ||
| Line 18: | Line 17: | ||
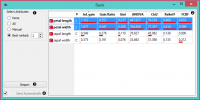
[[File:Rank-stamped.png|center|200px|thumb]] | [[File:Rank-stamped.png|center|200px|thumb]] | ||
| − | + | * Select attributes from the data table. | |
| + | * Data table with attributes (rows) and their scores by different scoring methods (columns) | ||
| + | * Produce a report. | ||
| + | * If ‘Send Automatically’ is ticked, the widget automatically communicates changes to other widgets. | ||
| − | + | ==Scoring method== | |
| − | + | Information Gain: the expected amount of information (reduction of entropy) | |
| − | + | * Gain Ratio: a ratio of the information gain and the attribute’s intrinsic information, which reduces the bias towards multivalued features that occurs in information gain | |
| + | * Gini: the inequality among values of a frequency distribution | ||
| + | * ANOVA: the difference between average vaules of the feature in different classes | ||
| + | * Chi2: dependence between the feature and the class as measure by the chi-square statistic | ||
| + | * ReliefF: the ability of an attribute to distinguish between classes on similar data instances | ||
| + | * FCBF (Fast Correlation Based Filter): entropy-based measure, which also identifies redundancy due to pairwise correlations between features | ||
| − | + | Additionally, you can connect certain learners that enable scoring the features according to how important they are in models that the learners build (e.g. Linear Regression / Logistic Regression, Random Forest, SGD). | |
| − | + | ==Example: Attribute Ranking and Selection== | |
| − | |||
| − | |||
| − | |||
| − | |||
| − | |||
| − | |||
| − | |||
| − | |||
| − | |||
| − | Example: Attribute Ranking and Selection | ||
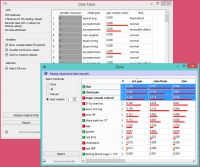
Below, we have used the Rank widget immediately after the File widget to reduce the set of data attributes and include only the most informative ones: | Below, we have used the Rank widget immediately after the File widget to reduce the set of data attributes and include only the most informative ones: | ||
Revision as of 08:14, 28 January 2020
Sumber: https://docs.biolab.si//3/visual-programming/widgets/data/rank.html
Ranking of attributes in classification or regression datasets.
Input
Data: input dataset
Scorer: models for feature scoring
Output
Reduced Data: dataset with selected attributes
The Rank widget considers class-labeled datasets (classification or regression) and scores the attributes according to their correlation with the class. Rank accepts also models for scoring, such as linear regression, logistic regression, random forest, SGD, etc.
- Select attributes from the data table.
- Data table with attributes (rows) and their scores by different scoring methods (columns)
- Produce a report.
- If ‘Send Automatically’ is ticked, the widget automatically communicates changes to other widgets.
Scoring method
Information Gain: the expected amount of information (reduction of entropy)
- Gain Ratio: a ratio of the information gain and the attribute’s intrinsic information, which reduces the bias towards multivalued features that occurs in information gain
- Gini: the inequality among values of a frequency distribution
- ANOVA: the difference between average vaules of the feature in different classes
- Chi2: dependence between the feature and the class as measure by the chi-square statistic
- ReliefF: the ability of an attribute to distinguish between classes on similar data instances
- FCBF (Fast Correlation Based Filter): entropy-based measure, which also identifies redundancy due to pairwise correlations between features
Additionally, you can connect certain learners that enable scoring the features according to how important they are in models that the learners build (e.g. Linear Regression / Logistic Regression, Random Forest, SGD).
Example: Attribute Ranking and Selection
Below, we have used the Rank widget immediately after the File widget to reduce the set of data attributes and include only the most informative ones:
Notice how the widget outputs a dataset that includes only the best-scored attributes:
Example: Feature Subset Selection for Machine Learning
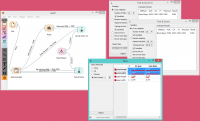
What follows is a bit more complicated example. In the workflow below, we first split the data into a training set and a test set. In the upper branch, the training data passes through the Rank widget to select the most informative attributes, while in the lower branch there is no feature selection. Both feature selected and original datasets are passed to their own Test & Score widgets, which develop a Naive Bayes classifier and score it on a test set.
For datasets with many features, a naive Bayesian classifier feature selection, as shown above, would often yield a better predictive accuracy.


