Difference between revisions of "Orange: Periodogram"
Jump to navigation
Jump to search
Onnowpurbo (talk | contribs) (Created page with "Sumber: https://orange.biolab.si/widget-catalog/time-series/periodogram/ Visualize time series’ cycles, seasonality, periodicity, and most significant periods. Inputs...") |
Onnowpurbo (talk | contribs) |
||
| Line 8: | Line 8: | ||
In this widget, you can visualize the most significant periods of the time series. | In this widget, you can visualize the most significant periods of the time series. | ||
| + | |||
| + | [[File:Periodogram-stamped.png|center|200px|thumb]] | ||
Select the series to calculate the periodogram for. | Select the series to calculate the periodogram for. | ||
| Line 13: | Line 15: | ||
Periodogram for non-equispaced series is calculated using Lomb-Scargle method. | Periodogram for non-equispaced series is calculated using Lomb-Scargle method. | ||
| − | See also | + | |
| + | ==See also== | ||
Correlogram | Correlogram | ||
Revision as of 07:26, 26 January 2020
Sumber: https://orange.biolab.si/widget-catalog/time-series/periodogram/
Visualize time series’ cycles, seasonality, periodicity, and most significant periods.
Inputs
Time series: Time series as output by As Timeseries widget.
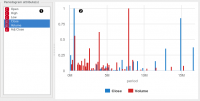
In this widget, you can visualize the most significant periods of the time series.
   Select the series to calculate the periodogram for.
   See the periods and their respective relative power spectral density estimates.
Periodogram for non-equispaced series is calculated using Lomb-Scargle method.
See also
Correlogram
