Difference between revisions of "Data Science: Implementasi Tanpa Programming"
Onnowpurbo (talk | contribs) (Created page with " center|700px|thumb|Data Science TANPA PROGRAMMING ==Pranala Menarik== * Data Science") |
Onnowpurbo (talk | contribs) |
||
| Line 4: | Line 4: | ||
| − | == | + | == Data Science Process == |
| + | |||
| + | The image provides a structured overview of the '''Data Science Process''', highlighting the key steps involved in handling data for analysis and decision-making. It also emphasizes how individuals can start learning data science with '''zero programming experience'''. | ||
| + | |||
| + | === Steps in the Data Science Process === | ||
| + | |||
| + | 1. '''Ask an Interesting Question''' | ||
| + | ** Define the '''scientific goal''' of the analysis. | ||
| + | ** Determine what you want to '''predict''' or '''estimate'''. | ||
| + | |||
| + | 2. '''Get the Data''' | ||
| + | ** Identify '''how''' the data were sampled. | ||
| + | ** Determine which data are '''relevant'''. | ||
| + | ** Address '''privacy concerns'''. | ||
| + | |||
| + | 3. '''Explore the Data''' | ||
| + | ** '''Plot''' the data for visualization. | ||
| + | ** Identify '''anomalies''' or unexpected values. | ||
| + | ** Detect '''patterns''' in the dataset. | ||
| + | |||
| + | 4. '''Model the Data''' | ||
| + | ** '''Build''' a statistical or machine learning model. | ||
| + | ** '''Fit''' the model to the data. | ||
| + | ** '''Validate''' the model to ensure accuracy. | ||
| + | |||
| + | 5. '''Communicate and Visualize the Results''' | ||
| + | ** Extract key '''learnings''' from the analysis. | ||
| + | ** Ensure the results '''make sense'''. | ||
| + | ** Present findings in a '''storytelling''' format. | ||
| + | |||
| + | This process is based on the work of Joe Blitzstein and Hanspeter Pfister, originally developed for Harvard’s data science course. | ||
| + | |||
| + | === How to Start Data Science with Zero Programming Experience === | ||
| + | |||
| + | The right section of the image emphasizes that data science can be approached without prior programming knowledge. It suggests that beginners can start learning by: | ||
| + | |||
| + | * Using data '''visualization tools'''. | ||
| + | * Exploring '''no-code or low-code platforms'''. | ||
| + | * Understanding '''basic concepts''' like data patterns and insights. | ||
| + | |||
| + | The three small graphs at the top right illustrate different types of '''data visualizations''', which are crucial for analyzing and presenting data effectively. | ||
| + | |||
| + | === Conclusion === | ||
| + | |||
| + | The image provides a beginner-friendly roadmap for getting started with '''data science''', emphasizing the importance of asking the right questions, collecting and exploring data, building models, and communicating insights. Even without coding experience, one can enter the field by learning fundamental '''data analysis techniques''' and utilizing available tools. | ||
| + | |||
| + | |||
| + | |||
| + | ==Interesting Links== | ||
* [[Data Science]] | * [[Data Science]] | ||
Latest revision as of 19:34, 10 February 2025
Data Science Process
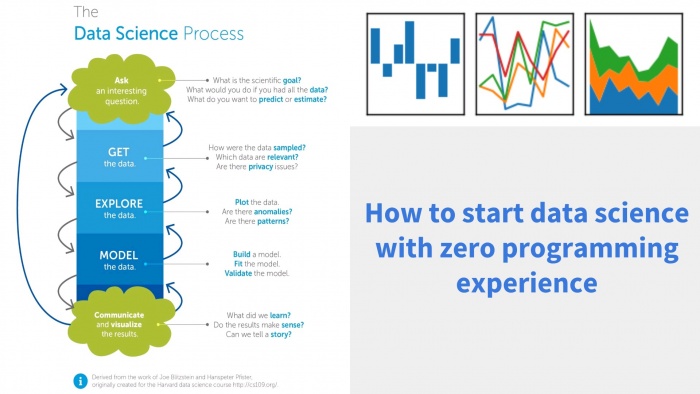
The image provides a structured overview of the Data Science Process, highlighting the key steps involved in handling data for analysis and decision-making. It also emphasizes how individuals can start learning data science with zero programming experience.
Steps in the Data Science Process
1. Ask an Interesting Question
- Define the scientific goal of the analysis.
- Determine what you want to predict or estimate.
2. Get the Data
- Identify how the data were sampled.
- Determine which data are relevant.
- Address privacy concerns.
3. Explore the Data
- Plot the data for visualization.
- Identify anomalies or unexpected values.
- Detect patterns in the dataset.
4. Model the Data
- Build a statistical or machine learning model.
- Fit the model to the data.
- Validate the model to ensure accuracy.
5. Communicate and Visualize the Results
- Extract key learnings from the analysis.
- Ensure the results make sense.
- Present findings in a storytelling format.
This process is based on the work of Joe Blitzstein and Hanspeter Pfister, originally developed for Harvard’s data science course.
How to Start Data Science with Zero Programming Experience
The right section of the image emphasizes that data science can be approached without prior programming knowledge. It suggests that beginners can start learning by:
- Using data visualization tools.
- Exploring no-code or low-code platforms.
- Understanding basic concepts like data patterns and insights.
The three small graphs at the top right illustrate different types of data visualizations, which are crucial for analyzing and presenting data effectively.
Conclusion
The image provides a beginner-friendly roadmap for getting started with data science, emphasizing the importance of asking the right questions, collecting and exploring data, building models, and communicating insights. Even without coding experience, one can enter the field by learning fundamental data analysis techniques and utilizing available tools.
