Difference between revisions of "Orange: Data Sampler"
Onnowpurbo (talk | contribs) (Created page with "Sumber: https://docs.biolab.si//3/visual-programming/widgets/data/datasampler.html Selects a subset of data instances from an input dataset. Inputs Data: input dataset...") |
Onnowpurbo (talk | contribs) |
||
| Line 15: | Line 15: | ||
The Data Sampler widget implements several data sampling methods. It outputs a sampled and a complementary dataset (with instances from the input set that are not included in the sampled dataset). The output is processed after the input dataset is provided and Sample Data is pressed. | The Data Sampler widget implements several data sampling methods. It outputs a sampled and a complementary dataset (with instances from the input set that are not included in the sampled dataset). The output is processed after the input dataset is provided and Sample Data is pressed. | ||
| − | + | [[File:DataSampler-stamped.png|center|200px|thumb]] | |
Information on the input and output dataset. | Information on the input and output dataset. | ||
| Line 38: | Line 38: | ||
First, let’s see how the Data Sampler works. We will use the iris data from the File widget. We see there are 150 instances in the data. We sampled the data with the Data Sampler widget and we chose to go with a fixed sample size of 5 instances for simplicity. We can observe the sampled data in the Data Table widget (Data Table (in-sample)). The second Data Table (Data Table (out-of-sample)) shows the remaining 145 instances that weren’t in the sample. To output the out-of-sample data, double-click the connection between the widgets and rewire the output to Remaining Data –> Data. | First, let’s see how the Data Sampler works. We will use the iris data from the File widget. We see there are 150 instances in the data. We sampled the data with the Data Sampler widget and we chose to go with a fixed sample size of 5 instances for simplicity. We can observe the sampled data in the Data Table widget (Data Table (in-sample)). The second Data Table (Data Table (out-of-sample)) shows the remaining 145 instances that weren’t in the sample. To output the out-of-sample data, double-click the connection between the widgets and rewire the output to Remaining Data –> Data. | ||
| − | + | [[File:DataSampler-Example1.png|center|200px|thumb]] | |
Now, we will use the Data Sampler to split the data into training and testing part. We are using the iris data, which we loaded with the File widget. In Data Sampler, we split the data with Fixed proportion of data, keeping 70% of data instances in the sample. | Now, we will use the Data Sampler to split the data into training and testing part. We are using the iris data, which we loaded with the File widget. In Data Sampler, we split the data with Fixed proportion of data, keeping 70% of data instances in the sample. | ||
| Line 44: | Line 44: | ||
Then we connected two outputs to the Test & Score widget, Data Sample –> Data and Remaining Data –> Test Data. Finally, we added Logistic Regression as the learner. This runs logistic regression on the Data input and evaluates the results on the Test Data. | Then we connected two outputs to the Test & Score widget, Data Sample –> Data and Remaining Data –> Test Data. Finally, we added Logistic Regression as the learner. This runs logistic regression on the Data input and evaluates the results on the Test Data. | ||
| − | + | [[File:DataSampler-Example2.png|center|200px|thumb]] | |
| − | Over/Undersampling | + | |
| + | ==Over/Undersampling== | ||
Data Sampler can also be used to oversample a minority class or undersample majority class in the data. Let us show an example for oversampling. First, separate the minority class using a Select Rows widget. We are using the iris data from the File widget. The data set has 150 data instances, 50 of each class. Let us oversample, say, iris-setosa. | Data Sampler can also be used to oversample a minority class or undersample majority class in the data. Let us show an example for oversampling. First, separate the minority class using a Select Rows widget. We are using the iris data from the File widget. The data set has 150 data instances, 50 of each class. Let us oversample, say, iris-setosa. | ||
| Line 53: | Line 54: | ||
Finally, use Concatenate to join the oversampled instances and the Unmatched Data output of the Select Rows widget. This outputs a data set with 200 instances. We can observe the final results in the Distributions. | Finally, use Concatenate to join the oversampled instances and the Unmatched Data output of the Select Rows widget. This outputs a data set with 200 instances. We can observe the final results in the Distributions. | ||
| − | + | [[File:DataSampler-Example-OverUnderSampling.png|center|200px|thumb]] | |
| + | |||
Revision as of 11:06, 21 January 2020
Sumber: https://docs.biolab.si//3/visual-programming/widgets/data/datasampler.html
Selects a subset of data instances from an input dataset.
Inputs
Data: input dataset
Outputs
Data Sample: sampled data instances
Remaining Data: out-of-sample data
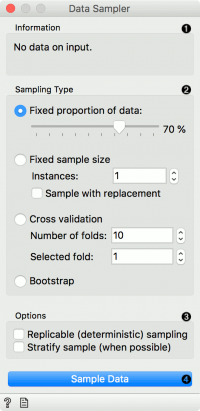
The Data Sampler widget implements several data sampling methods. It outputs a sampled and a complementary dataset (with instances from the input set that are not included in the sampled dataset). The output is processed after the input dataset is provided and Sample Data is pressed.
Information on the input and output dataset.
The desired sampling method:
Fixed proportion of data returns a selected percentage of the entire data (e.g. 70% of all the data)
Fixed sample size returns a selected number of data instances with a chance to set Sample with replacement, which always samples from the entire dataset (does not subtract instances already in the subset). With replacement, you can generate more instances than available in the input dataset.
Cross Validation partitions data instances into complementary subsets, where you can select the number of folds (subsets) and which fold you want to use as a sample.
Bootstrap infers the sample from the population statistic.
Replicable sampling maintains sampling patterns that can be carried across users, while stratify sample mimics the composition of the input dataset.
Press Sample Data to output the data sample.
If all data instances are selected (by setting the proportion to 100 % or setting the fixed sample size to the entire data size), output instances are still shuffled. Examples
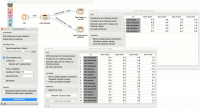
First, let’s see how the Data Sampler works. We will use the iris data from the File widget. We see there are 150 instances in the data. We sampled the data with the Data Sampler widget and we chose to go with a fixed sample size of 5 instances for simplicity. We can observe the sampled data in the Data Table widget (Data Table (in-sample)). The second Data Table (Data Table (out-of-sample)) shows the remaining 145 instances that weren’t in the sample. To output the out-of-sample data, double-click the connection between the widgets and rewire the output to Remaining Data –> Data.
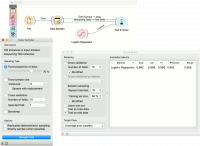
Now, we will use the Data Sampler to split the data into training and testing part. We are using the iris data, which we loaded with the File widget. In Data Sampler, we split the data with Fixed proportion of data, keeping 70% of data instances in the sample.
Then we connected two outputs to the Test & Score widget, Data Sample –> Data and Remaining Data –> Test Data. Finally, we added Logistic Regression as the learner. This runs logistic regression on the Data input and evaluates the results on the Test Data.
Over/Undersampling
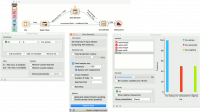
Data Sampler can also be used to oversample a minority class or undersample majority class in the data. Let us show an example for oversampling. First, separate the minority class using a Select Rows widget. We are using the iris data from the File widget. The data set has 150 data instances, 50 of each class. Let us oversample, say, iris-setosa.
In Select Rows, set the condition to iris is iris-setosa. This will output 50 instances of the iris-setosa class. Now, connect Matching Data into the Data Sampler, select Fixed sample size, set it to, say, 100 and select Sample with replacement. Upon pressing Sample Data, the widget will output 100 instances of iris-setosa class, some of which will be duplicated (because we used Sample with replacement).
Finally, use Concatenate to join the oversampled instances and the Unmatched Data output of the Select Rows widget. This outputs a data set with 200 instances. We can observe the final results in the Distributions.


