Difference between revisions of "Orange: Box Plot"
Onnowpurbo (talk | contribs) |
Onnowpurbo (talk | contribs) (→Contoh) |
||
| (4 intermediate revisions by the same user not shown) | |||
| Line 34: | Line 34: | ||
==Contoh== | ==Contoh== | ||
| − | Widget Box Plot paling umum digunakan segera setelah File widget untuk mengamati properti statistik dari suatu dataset. Dalam contoh | + | Widget Box Plot paling umum digunakan segera setelah File widget untuk mengamati properti statistik dari suatu dataset. Dalam contoh ini, kita telah menggunakan heart-disease data untuk memeriksa variabel kita. |
| − | [[File:BoxPlot-Example1.png|center| | + | [[File:BoxPlot-Example1.png|center|600px|thumb]] |
| − | Box Plot | + | Box Plot juga berguna untuk menemukan properti dari dataset tertentu, misalnya satu set instance yang ditentukan secara manual di widget lain (misalnya Scatter Plot, atau instance dari beberapa cluster, atau node klasifikasi tree). |
| − | |||
| − | |||
| − | |||
| − | |||
| + | Contoh selanjutnya, kita menggunakan zoo data dan membuat workflow clustering dengan Distances and Hierarchical Clustering. Sekarang tentukan threshold untuk pemilihan cluster (klik pada ruler di atas). Hubungkan Box Plot ke Hierarchical Clustering, centang Order by relevance dan pilih Cluster as a subgroup. Ini akan mengurut atribut dengan seberapa baik mereka mendefinisikan subgroup yang dipilih, dalam kasus kita sebuah cluster. Sepertinya cluster kita memang sangat cocok dengan jenis hewan! | ||
| + | [[File:BoxPlot-Example2.png|center|600px|thumb]] | ||
==Referensi== | ==Referensi== | ||
Latest revision as of 04:18, 9 April 2020
Sumber: https://docs.biolab.si//3/visual-programming/widgets/visualize/boxplot.html
Menunjukkan distribusi nilai atribut.
Input
Data: input dataset
Output
   Selected Data: instances selected from the plot
   Data: data with an additional column showing whether a point is selected
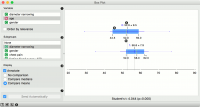
Widget Box Plot menunjukkan distribusi nilai atribut. Merupakan praktik yang baik untuk memeriksa data baru apa pun dengan widget ini untuk menemukan anomali dengan cepat, seperti nilai duplikat (mis. gray atau grey), outliers, dan sejenisnya.
- Select the variable you want to plot. Tick Order by relevance to order variables by Chi2 or ANOVA over the selected subgroup.
- Choose Subgroups to see box plots displayed by a discrete subgroup.
- When instances are grouped by a subgroup, you can change the display mode. Annotated boxes will display the end values, the mean and the median, while compare medians and compare means will, naturally, compare the selected value between subgroups. continuous
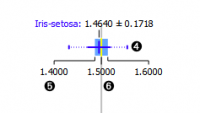
- The mean (the dark blue vertical line). The thin blue line represents the standard deviation.
- Values of the first (25%) and the third (75%) quantile. The blue highlighted area represents the values between the first and the third quartile.
- The median (yellow vertical line).
- If Send automatically is ticked, changes are communicated automatically. Alternatively, press Send.
- Access help, save image or produce a report.
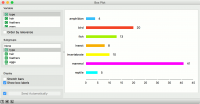
Untuk atribut diskrit, bar akan mewakili jumlah instance dengan setiap nilai atribut tertentu. Plot menunjukkan jumlah jenis hewan yang berbeda dalam dataset Zoo: ada 41 mamalia, 13 ikan, 20 burung dan sebagainya.
Contoh
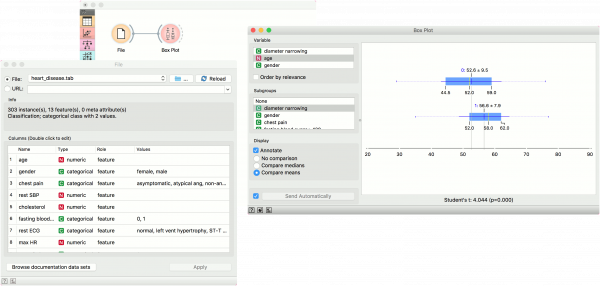
Widget Box Plot paling umum digunakan segera setelah File widget untuk mengamati properti statistik dari suatu dataset. Dalam contoh ini, kita telah menggunakan heart-disease data untuk memeriksa variabel kita.
Box Plot juga berguna untuk menemukan properti dari dataset tertentu, misalnya satu set instance yang ditentukan secara manual di widget lain (misalnya Scatter Plot, atau instance dari beberapa cluster, atau node klasifikasi tree).
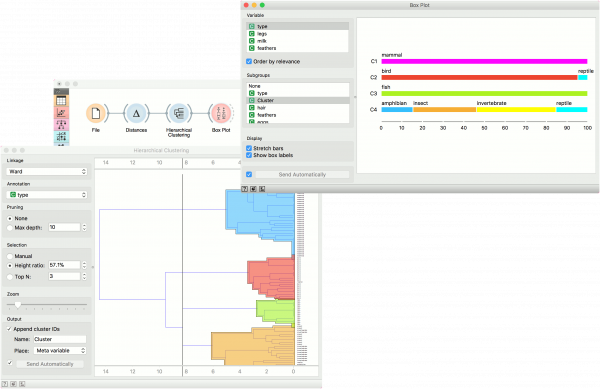
Contoh selanjutnya, kita menggunakan zoo data dan membuat workflow clustering dengan Distances and Hierarchical Clustering. Sekarang tentukan threshold untuk pemilihan cluster (klik pada ruler di atas). Hubungkan Box Plot ke Hierarchical Clustering, centang Order by relevance dan pilih Cluster as a subgroup. Ini akan mengurut atribut dengan seberapa baik mereka mendefinisikan subgroup yang dipilih, dalam kasus kita sebuah cluster. Sepertinya cluster kita memang sangat cocok dengan jenis hewan!
