Difference between revisions of "Orange: Correspondence Analysis"
Onnowpurbo (talk | contribs) |
Onnowpurbo (talk | contribs) (→Contoh) |
||
| (One intermediate revision by the same user not shown) | |||
| Line 2: | Line 2: | ||
| − | Correspondence analysis | + | Correspondence analysis untuk categorical multivariate data. |
==Input== | ==Input== | ||
| Line 12: | Line 12: | ||
Coordinates: coordinates of all components | Coordinates: coordinates of all components | ||
| − | Correspondence Analysis (CA) | + | Correspondence Analysis (CA) menghitung transformasi linear CA dari data input. Meskipun mirip dengan PCA, CA menghitung transformasi linear pada data diskrit bukan pada data kontinu. |
[[File:CorrespondenceAnalysis-stamped.png|center|200px|thumb]] | [[File:CorrespondenceAnalysis-stamped.png|center|200px|thumb]] | ||
| − | |||
* Select the variables you want to see plotted. | * Select the variables you want to see plotted. | ||
| Line 24: | Line 23: | ||
==Contoh== | ==Contoh== | ||
| − | + | Di bawah, adalah perbandingan sederhana antara widget Correspondence Analysis dan Scatter Plot pada dataset Titanic. Sementara Scatter Plot menunjukkan dengan cukup baik kelas dan jenis kelamin mana yang memiliki tingkat kelangsungan hidup yang baik dan mana yang tidak, Correspondence Analysis dapat memplot beberapa variabel dalam grafik 2-D, sehingga memudahkan untuk melihat hubungan antara nilai-nilai variabel. Jelas dari grafik bahwa “no”, “male” dan “crew” terkait satu sama lain. Hal yang sama berlaku untuk “yes”, “female” dan “first”. | |
[[File:CorrespondenceAnalysis-Example.png|center|200px|thumb]] | [[File:CorrespondenceAnalysis-Example.png|center|200px|thumb]] | ||
| − | + | '''WARNING:''' Scatter Plot yang baru tidak bisa untuk diskrit data. Scatter Plot yang baru hanya untuk data kontinyu. | |
==Referensi== | ==Referensi== | ||
Latest revision as of 05:45, 23 February 2020
Sumber: https://docs.biolab.si//3/visual-programming/widgets/unsupervised/correspondenceanalysis.html
Correspondence analysis untuk categorical multivariate data.
Input
Data: input dataset
Output
Coordinates: coordinates of all components
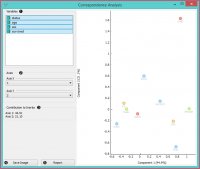
Correspondence Analysis (CA) menghitung transformasi linear CA dari data input. Meskipun mirip dengan PCA, CA menghitung transformasi linear pada data diskrit bukan pada data kontinu.
- Select the variables you want to see plotted.
- Select the component for each axis.
- Inertia values (percentage of independence from transformation, i.e. variables are in the same dimension).
- Produce a report.
Contoh
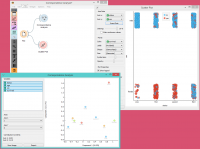
Di bawah, adalah perbandingan sederhana antara widget Correspondence Analysis dan Scatter Plot pada dataset Titanic. Sementara Scatter Plot menunjukkan dengan cukup baik kelas dan jenis kelamin mana yang memiliki tingkat kelangsungan hidup yang baik dan mana yang tidak, Correspondence Analysis dapat memplot beberapa variabel dalam grafik 2-D, sehingga memudahkan untuk melihat hubungan antara nilai-nilai variabel. Jelas dari grafik bahwa “no”, “male” dan “crew” terkait satu sama lain. Hal yang sama berlaku untuk “yes”, “female” dan “first”.
WARNING: Scatter Plot yang baru tidak bisa untuk diskrit data. Scatter Plot yang baru hanya untuk data kontinyu.

