Difference between revisions of "Orange: PCA"
Onnowpurbo (talk | contribs) |
Onnowpurbo (talk | contribs) (→Output) |
||
| (4 intermediate revisions by the same user not shown) | |||
| Line 2: | Line 2: | ||
| − | PCA | + | PCA mentransformasikan input data. |
| − | + | ==Input== | |
| − | + | Data: input dataset | |
| − | + | ==Output== | |
| − | + | Transformed Data: PCA transformed data | |
| − | + | Components: Eigenvectors. | |
| − | Principal Component Analysis (PCA) | + | Principal Component Analysis (PCA) menghitung PCA linear transformation dari input data. Dia mengeluarkan sebuah transformed dataset dengan weight dari individual instance atau weight dari principal components. |
| + | [[File:PCA-stamped.png|center|200px|thumb]] | ||
| − | |||
| − | + | * Select how many principal components you wish in your output. It is best to choose as few as possible with variance covered as high as possible. You can also set how much variance you wish to cover with your principal components. | |
| − | + | * You can normalize data to adjust the values to common scale. | |
| − | + | * When Apply Automatically is ticked, the widget will automatically communicate all changes. Alternatively, click Apply. | |
| − | + | * Press Save Image if you want to save the created image to your computer. | |
| − | + | * Produce a report. | |
| − | + | * Principal components graph, where the red (lower) line is the variance covered per component and the green (upper) line is cumulative variance covered by components. | |
| − | + | Jumlah komponen transformasi dapat dipilih dari Components Selection input box atau dengan drag vertical cutoff line di grafik. | |
==Contoh== | ==Contoh== | ||
| − | PCA | + | PCA dapat digunakan untuk menyederhanakan visualisasi dataset yang besar. Di bawah ini, kita menggunakan dataset Iris untuk menunjukkan bagaimana kita dapat meningkatkan visualisasi dataset dengan PCA. Data yang diubah dalam Scatter Plot menunjukkan perbedaan yang jauh lebih jelas antara kelas daripada pengaturan default. |
| − | + | [[File:PCAExample.png|center|200px|thumb]] | |
| − | + | Widget ini menyediakan dua output: transformed data dan principal component. Transformed Data adalah weight untuk individual instance dalam sistem koordinat baru, sedangkan component adalah deskriptor sistem (weight untuk principal component). Saat dimasukkan ke dalam Data Table, kita bisa melihat kedua output dalam bentuk angka. Kita menggunakan dua tabel data untuk menyediakan visualisasi workflowa yang lebih bersih, tetapi kita juga dapat memilih untuk mengedit link sedemikian rupa sehingga kita menampilkan data hanya dalam satu tabel data. Kita hanya perlu membuat dua link dan menghubungkan input data dan komponen yang ditransformasikan ke output data. | |
| + | |||
| + | [[File:PCAExample2.png|center|200px|thumb]] | ||
| − | |||
Latest revision as of 04:13, 23 February 2020
Sumber: https://docs.biolab.si//3/visual-programming/widgets/unsupervised/PCA.html
PCA mentransformasikan input data.
Input
Data: input dataset
Output
Transformed Data: PCA transformed data
Components: Eigenvectors.
Principal Component Analysis (PCA) menghitung PCA linear transformation dari input data. Dia mengeluarkan sebuah transformed dataset dengan weight dari individual instance atau weight dari principal components.
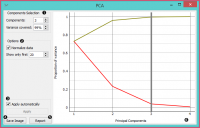
- Select how many principal components you wish in your output. It is best to choose as few as possible with variance covered as high as possible. You can also set how much variance you wish to cover with your principal components.
- You can normalize data to adjust the values to common scale.
- When Apply Automatically is ticked, the widget will automatically communicate all changes. Alternatively, click Apply.
- Press Save Image if you want to save the created image to your computer.
- Produce a report.
- Principal components graph, where the red (lower) line is the variance covered per component and the green (upper) line is cumulative variance covered by components.
Jumlah komponen transformasi dapat dipilih dari Components Selection input box atau dengan drag vertical cutoff line di grafik.
Contoh
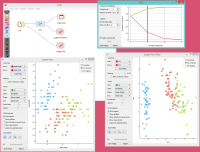
PCA dapat digunakan untuk menyederhanakan visualisasi dataset yang besar. Di bawah ini, kita menggunakan dataset Iris untuk menunjukkan bagaimana kita dapat meningkatkan visualisasi dataset dengan PCA. Data yang diubah dalam Scatter Plot menunjukkan perbedaan yang jauh lebih jelas antara kelas daripada pengaturan default.
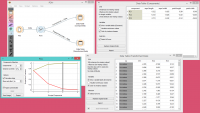
Widget ini menyediakan dua output: transformed data dan principal component. Transformed Data adalah weight untuk individual instance dalam sistem koordinat baru, sedangkan component adalah deskriptor sistem (weight untuk principal component). Saat dimasukkan ke dalam Data Table, kita bisa melihat kedua output dalam bentuk angka. Kita menggunakan dua tabel data untuk menyediakan visualisasi workflowa yang lebih bersih, tetapi kita juga dapat memilih untuk mengedit link sedemikian rupa sehingga kita menampilkan data hanya dalam satu tabel data. Kita hanya perlu membuat dua link dan menghubungkan input data dan komponen yang ditransformasikan ke output data.


