Difference between revisions of "Orange: SVM"
Onnowpurbo (talk | contribs) |
Onnowpurbo (talk | contribs) |
||
| (8 intermediate revisions by the same user not shown) | |||
| Line 2: | Line 2: | ||
| − | Support Vector Machines | + | Widget SVM (Support Vector Machines) melakukan mapping dari input ke higher-dimensional feature space. |
| − | + | ==Input== | |
| − | + | Data: input dataset | |
| − | + | Preprocessor: preprocessing method(s) | |
| − | + | ==Output== | |
| − | + | Learner: linear regression learning algorithm | |
| − | + | Model: trained model | |
| − | + | Support Vectors: instances used as support vectors | |
| − | Support | + | Support Vector machine (SVM) adalah teknik machine learning yang memisahkan ruang atribut dengan hyperplane, sehingga memaksimalkan margin antara instance class yang berbeda atau nilai class. Teknik ini sering menghasilkan hasil kinerja prediksi tertinggi. Orange menanamkan implementasi populer SVM dari paket LIBSVM. Widget SVM adalah graphical user interface-nya. |
| − | + | Untuk task regression, SVM akan melakukan linear regression di high dimension feature space menggunakan ε-insensitive loss. Dia akan mengestimasi keakuratan tergantung pada settingan parameter C, ε dan kernel. Widget SVM akan mengeluarkan prediksi class berdasarkan SVM Regression. | |
| − | + | Widget SVM dapat berfungsi untuk task classification dan regression. | |
[[File:SVM-stamped.png|center|200px|thumb]] | [[File:SVM-stamped.png|center|200px|thumb]] | ||
| − | + | * The learner can be given a name under which it will appear in other widgets. The default name is “SVM”. | |
| − | + | * SVM type with test error settings. SVM and ν-SVM are based on different minimization of the error function. On the right side, you can set test error bounds: | |
| − | + | ** SVM: | |
| − | + | *** Cost: penalty term for loss and applies for classification and regression tasks. | |
| − | + | *** ε: a parameter to the epsilon-SVR model, applies to regression tasks. Defines the distance from true values within which no penalty is associated with predicted values. | |
| − | |||
| − | |||
| − | |||
| − | |||
| − | + | ** ν-SVM: | |
| − | + | *** Cost: penalty term for loss and applies only to regression tasks | |
| − | + | *** ν: a parameter to the ν-SVR model, applies to classification and regression tasks. An upper bound on the fraction of training errors and a lower bound of the fraction of support vectors. | |
| − | + | ||
| − | + | * Kernel is a function that transforms attribute space to a new feature space to fit the maximum-margin hyperplane, thus allowing the algorithm to create the model with Linear, Polynomial, RBF and Sigmoid kernels. Functions that specify the kernel are presented upon selecting them, and the constants involved are: | |
| − | + | ** g for the gamma constant in kernel function (the recommended value is 1/k, where k is the number of the attributes, but since there may be no training set given to the widget the default is 0 and the user has to set this option manually), | |
| + | ** c for the constant c0 in the kernel function (default 0), and | ||
| + | ** d for the degree of the kernel (default 3). | ||
| + | |||
| + | * Set permitted deviation from the expected value in Numerical Tolerance. Tick the box next to Iteration Limit to set the maximum number of iterations permitted. | ||
| + | * Produce a report. | ||
| + | * Click Apply to commit changes. If you tick the box on the left side of the Apply button, changes will be communicated automatically. | ||
==Contoh== | ==Contoh== | ||
| − | + | Untuk contoh regresi, kita menggunakan dataset housing dan membagi data menjadi dua subset data (Data Sampel dan Data Sisa / Remaining) menggunakan widget Data Sampler. Sampel dikirim ke Widget SVM yang menghasilkan Model, yang kemudian digunakan dalam Widget Predictions untuk memprediksi nilai pada Data Sisa. Skema serupa dapat digunakan jika data sudah dalam dua file terpisah; dalam hal ini, dua widget File akan digunakan daripada memecah data menggunakan Widget File - Widget Data Sampler. | |
| + | |||
| + | [[File:SVM-Predictions.png|center|600px|thumb]] | ||
| − | + | Contoh berikut menunjukkan cara menggunakan widget SVM dalam kombinasi dengan widget Scatter Plot. Workflow berikut men-train model widget SVM pada data iris dan mengeluarkan support vector, yang merupakan contoh data yang digunakan sebagai support vector pada fase learning. Kita dapat mengamati contoh data ini dalam visualisasi widget Scatter Plot. Perhatikan bahwa agar workflow berfungsi dengan benar, kita harus mengatur link antara widget seperti yang ditunjukkan pada screenshot di bawah ini. | |
| − | + | [[File:SVM-support-vectors.png|center|600px|thumb]] | |
| − | [ | + | ==Youtube== |
| + | |||
| + | * [https://www.youtube.com/watch?v=mbuEa8L24fw YOUTUBE: ORANGE Prediksi Menggunakan SVM] | ||
| Line 55: | Line 61: | ||
Introduction to SVM on StatSoft. | Introduction to SVM on StatSoft. | ||
| − | |||
| − | |||
| − | |||
==Referensi== | ==Referensi== | ||
Latest revision as of 04:46, 13 April 2020
Sumber: https://docs.biolab.si//3/visual-programming/widgets/model/svm.html
Widget SVM (Support Vector Machines) melakukan mapping dari input ke higher-dimensional feature space.
Input
Data: input dataset
Preprocessor: preprocessing method(s)
Output
Learner: linear regression learning algorithm
Model: trained model
Support Vectors: instances used as support vectors
Support Vector machine (SVM) adalah teknik machine learning yang memisahkan ruang atribut dengan hyperplane, sehingga memaksimalkan margin antara instance class yang berbeda atau nilai class. Teknik ini sering menghasilkan hasil kinerja prediksi tertinggi. Orange menanamkan implementasi populer SVM dari paket LIBSVM. Widget SVM adalah graphical user interface-nya.
Untuk task regression, SVM akan melakukan linear regression di high dimension feature space menggunakan ε-insensitive loss. Dia akan mengestimasi keakuratan tergantung pada settingan parameter C, ε dan kernel. Widget SVM akan mengeluarkan prediksi class berdasarkan SVM Regression.
Widget SVM dapat berfungsi untuk task classification dan regression.
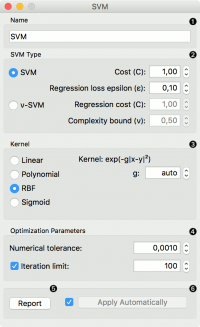
- The learner can be given a name under which it will appear in other widgets. The default name is “SVM”.
- SVM type with test error settings. SVM and ν-SVM are based on different minimization of the error function. On the right side, you can set test error bounds:
- SVM:
- Cost: penalty term for loss and applies for classification and regression tasks.
- ε: a parameter to the epsilon-SVR model, applies to regression tasks. Defines the distance from true values within which no penalty is associated with predicted values.
- SVM:
- ν-SVM:
- Cost: penalty term for loss and applies only to regression tasks
- ν: a parameter to the ν-SVR model, applies to classification and regression tasks. An upper bound on the fraction of training errors and a lower bound of the fraction of support vectors.
- ν-SVM:
- Kernel is a function that transforms attribute space to a new feature space to fit the maximum-margin hyperplane, thus allowing the algorithm to create the model with Linear, Polynomial, RBF and Sigmoid kernels. Functions that specify the kernel are presented upon selecting them, and the constants involved are:
- g for the gamma constant in kernel function (the recommended value is 1/k, where k is the number of the attributes, but since there may be no training set given to the widget the default is 0 and the user has to set this option manually),
- c for the constant c0 in the kernel function (default 0), and
- d for the degree of the kernel (default 3).
- Set permitted deviation from the expected value in Numerical Tolerance. Tick the box next to Iteration Limit to set the maximum number of iterations permitted.
- Produce a report.
- Click Apply to commit changes. If you tick the box on the left side of the Apply button, changes will be communicated automatically.
Contoh
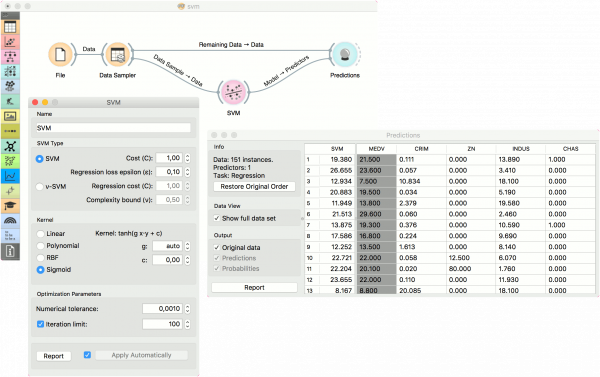
Untuk contoh regresi, kita menggunakan dataset housing dan membagi data menjadi dua subset data (Data Sampel dan Data Sisa / Remaining) menggunakan widget Data Sampler. Sampel dikirim ke Widget SVM yang menghasilkan Model, yang kemudian digunakan dalam Widget Predictions untuk memprediksi nilai pada Data Sisa. Skema serupa dapat digunakan jika data sudah dalam dua file terpisah; dalam hal ini, dua widget File akan digunakan daripada memecah data menggunakan Widget File - Widget Data Sampler.
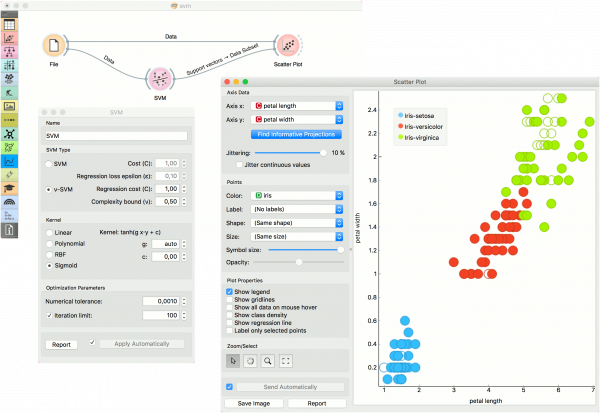
Contoh berikut menunjukkan cara menggunakan widget SVM dalam kombinasi dengan widget Scatter Plot. Workflow berikut men-train model widget SVM pada data iris dan mengeluarkan support vector, yang merupakan contoh data yang digunakan sebagai support vector pada fase learning. Kita dapat mengamati contoh data ini dalam visualisasi widget Scatter Plot. Perhatikan bahwa agar workflow berfungsi dengan benar, kita harus mengatur link antara widget seperti yang ditunjukkan pada screenshot di bawah ini.
Youtube
Referensi
Introduction to SVM on StatSoft.


