Difference between revisions of "Orange: Paint Data"
Onnowpurbo (talk | contribs) (Created page with "Sumber: https://docs.biolab.si//3/visual-programming/widgets/data/paintdata.html Paints data on a 2D plane. You can place individual data points or use a brush to paint larg...") |
Onnowpurbo (talk | contribs) |
||
| (4 intermediate revisions by the same user not shown) | |||
| Line 2: | Line 2: | ||
| − | + | Widget Paint Data dapat melakukan paint data pada bidang 2D. Kita dapat menempatkan titik data individual atau menggunakan brush untuk paint dataset yang besar. | |
| − | + | ==Output== | |
| − | + | Data: dataset as painted in the plot | |
| − | + | Widget Paint Data mendukung pembuatan dataset baru dengan menempatkan titik data secara visual pada bidang dua dimensi. Point data dapat ditempatkan di bidang secara individual (Put) atau dalam jumlah yang lebih besar dengan brushing (Brush). Point data dapat menjadi milik class jika data tersebut dimaksudkan untuk digunakan dalam supervised learning. | |
| − | + | [[File:PaintData-stamped.png|center|600px|thumb]] | |
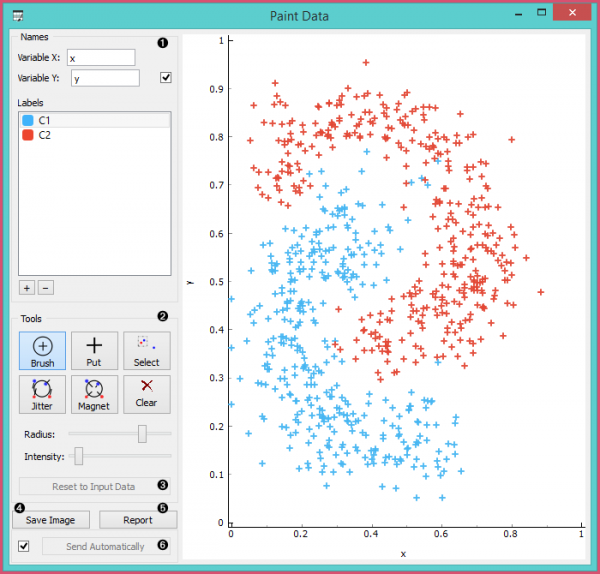
| − | + | * Name the axes and select a class to paint data instances. You can add or remove classes. Use only one class to create classless, unsupervised datasets. | |
| − | + | * Drawing tools. Paint data points with Brush (multiple data instances) or Put (individual data instance). Select data points with Select and remove them with the Delete/Backspace key. Reposition data points with Jitter (spread) and Magnet (focus). Use Zoom and scroll to zoom in or out. Below, set the radius and intensity for Brush, Put, Jitter and Magnet tools. | |
| − | + | * Reset to Input Data. | |
| − | + | * Save Image saves the image to your computer in a .svg or .png format. | |
| − | + | * Produce a report. | |
| − | + | * Tick the box on the left to automatically commit changes to other widgets. Alternatively, press Send to apply them. | |
| − | |||
| − | |||
| − | |||
| − | |||
| − | |||
| − | |||
| − | |||
| − | |||
| − | |||
| − | |||
| − | |||
| + | ==Contoh== | ||
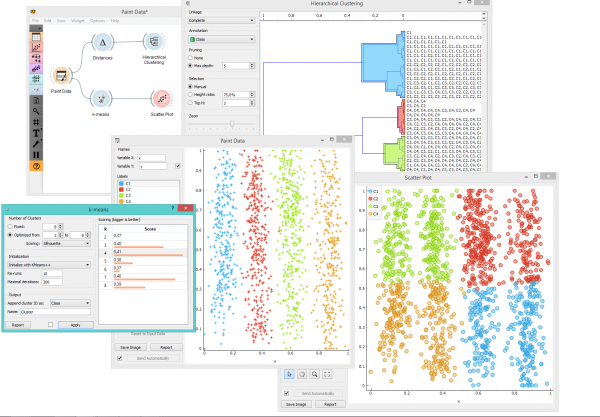
| + | Dalam contoh di bawah ini, widget Paint Data digunakan untuk paint dataset dengan 4 class. Dataset seperti ini baik untuk mendemonstrasikan metoda widget k-means and widget hierarchical clustering. Dalam screenshot, kita melihat bahwa widget k-Means, secara keseluruhan, mengenali cluster lebih baik daripada widget Hierarchical Clustering. Ini mengembalikan peringkat skor, di mana skor terbaik (yang dengan nilai tertinggi) berarti jumlah cluster yang paling mungkin. Namun, widget Hierarchical Clustering tidak mengelompokkan class yang tepat bersama. Widget Paint Data adalah tool yang baik untuk belajar dan mengeksplorasi konsep statistik. | ||
| + | [[File:PaintData-Example.png|center|600px|thumb]] | ||
==Referensi== | ==Referensi== | ||
Latest revision as of 09:17, 16 April 2020
Sumber: https://docs.biolab.si//3/visual-programming/widgets/data/paintdata.html
Widget Paint Data dapat melakukan paint data pada bidang 2D. Kita dapat menempatkan titik data individual atau menggunakan brush untuk paint dataset yang besar.
Output
Data: dataset as painted in the plot
Widget Paint Data mendukung pembuatan dataset baru dengan menempatkan titik data secara visual pada bidang dua dimensi. Point data dapat ditempatkan di bidang secara individual (Put) atau dalam jumlah yang lebih besar dengan brushing (Brush). Point data dapat menjadi milik class jika data tersebut dimaksudkan untuk digunakan dalam supervised learning.
- Name the axes and select a class to paint data instances. You can add or remove classes. Use only one class to create classless, unsupervised datasets.
- Drawing tools. Paint data points with Brush (multiple data instances) or Put (individual data instance). Select data points with Select and remove them with the Delete/Backspace key. Reposition data points with Jitter (spread) and Magnet (focus). Use Zoom and scroll to zoom in or out. Below, set the radius and intensity for Brush, Put, Jitter and Magnet tools.
- Reset to Input Data.
- Save Image saves the image to your computer in a .svg or .png format.
- Produce a report.
- Tick the box on the left to automatically commit changes to other widgets. Alternatively, press Send to apply them.
Contoh
Dalam contoh di bawah ini, widget Paint Data digunakan untuk paint dataset dengan 4 class. Dataset seperti ini baik untuk mendemonstrasikan metoda widget k-means and widget hierarchical clustering. Dalam screenshot, kita melihat bahwa widget k-Means, secara keseluruhan, mengenali cluster lebih baik daripada widget Hierarchical Clustering. Ini mengembalikan peringkat skor, di mana skor terbaik (yang dengan nilai tertinggi) berarti jumlah cluster yang paling mungkin. Namun, widget Hierarchical Clustering tidak mengelompokkan class yang tepat bersama. Widget Paint Data adalah tool yang baik untuk belajar dan mengeksplorasi konsep statistik.

