Difference between revisions of "Orange: Misclassifications"
Onnowpurbo (talk | contribs) |
Onnowpurbo (talk | contribs) |
||
| Line 29: | Line 29: | ||
* The note suggests that '''misclassifications''' are best seen in '''petal length vs. petal width projection'''. | * The note suggests that '''misclassifications''' are best seen in '''petal length vs. petal width projection'''. | ||
| − | + | =='''Purpose of the Workflow:'''== | |
* The workflow '''trains a logistic regression classifier''' on the Iris dataset. | * The workflow '''trains a logistic regression classifier''' on the Iris dataset. | ||
* It '''evaluates performance''' using a confusion matrix. | * It '''evaluates performance''' using a confusion matrix. | ||
| Line 36: | Line 36: | ||
This workflow helps in '''understanding classification errors''' and '''improving model performance''' by selecting better feature projections or classification methods. | This workflow helps in '''understanding classification errors''' and '''improving model performance''' by selecting better feature projections or classification methods. | ||
| − | |||
==Source== | ==Source== | ||
Latest revision as of 16:09, 11 February 2025
Sumber: https://orange.biolab.si/workflows/
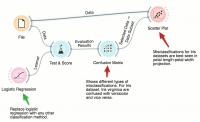
Cross-validation dari, misalnya, logistic regression dapat mengekspos instance data yang salah klasifikasi. Ada enam contoh untuk dataset iris dan ridge-regularized logistic regression. Kita dapat memilih berbagai jenis kesalahan klasifikasi dalam Confusion Matrix dan menayangkannya dalam Scatter Plot. Tidak mengherankan: contoh kesalahan klasifikasi berada dekat / wilayah daerah yang class-nya berbatasan terlihat di scatter plot projection.
The image represents an Orange Data Mining workflow designed for evaluating a classification model using logistic regression and visualizing misclassifications.
Workflow Breakdown:
1. File (Data Input)
- This node loads the dataset (likely the Iris dataset) as input for further processing.
2. Learner (Logistic Regression)
- The logistic regression model is used as the classification algorithm.
- The note in green suggests that this model can be replaced with any other classification method.
3. Test & Score
- This node is responsible for evaluating the logistic regression model.
- It measures the model’s performance using various metrics like accuracy, precision, recall, and F1-score.
4. Confusion Matrix
- Displays the types of misclassifications in the dataset.
- The note in red highlights that for the Iris dataset, Iris virginica and Iris versicolor are often confused with each other.
5. Scatter Plot
- Visualizes the data distribution and classification results.
- The note suggests that misclassifications are best seen in petal length vs. petal width projection.
Purpose of the Workflow:
- The workflow trains a logistic regression classifier on the Iris dataset.
- It evaluates performance using a confusion matrix.
- Misclassifications are visualized using a scatter plot.
- Users can swap the classification method to compare different algorithms.
This workflow helps in understanding classification errors and improving model performance by selecting better feature projections or classification methods.
Source
- https://service.biolab.si/download/workflow?name=470-misclassification-scatterplot.ows&domain=orange
