Difference between revisions of "Orange: Feature Ranking"
Jump to navigation
Jump to search
Onnowpurbo (talk | contribs) (Created page with "Sumber:https://orange.biolab.si/workflows/ For supervised problems, where data instances are annotated with class labels, we would like to know which are the most informativ...") |
Onnowpurbo (talk | contribs) |
||
| (4 intermediate revisions by the same user not shown) | |||
| Line 2: | Line 2: | ||
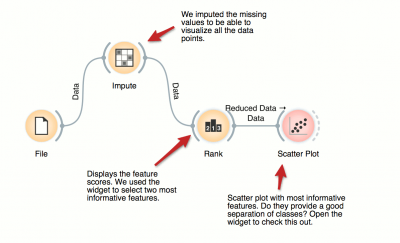
| − | + | Untuk masalah yang supervised, di mana instance data dijelaskan dengan class label, kita ingin tahu feature mana yang paling informatif. Widget Rank menyediakan tabel fitur dan skor informativitasnya, dan mendukung pemilihan fitur manual. Dalam workflow, kita menggunakannya untuk menemukan dua fitur terbaik (dari 79 awal dari dataset yang dipilih) dan menampilkan di widget Scatter Plot. | |
[[File:Feature-ranking.png|center|400px|thumb]] | [[File:Feature-ranking.png|center|400px|thumb]] | ||
| Line 8: | Line 8: | ||
==Source== | ==Source== | ||
| − | * https:// | + | * https://orangedatamining.com/workflows/Feature-Ranking/ |
==Referensi== | ==Referensi== | ||
| + | * YOUTUBE: https://www.youtube.com/watch?v=p5XLWmSUxTQ | ||
| + | * YOUTUBE: https://www.youtube.com/watch?v=Fw5SztV5p3E | ||
* https://orange.biolab.si/workflows/ | * https://orange.biolab.si/workflows/ | ||
Latest revision as of 08:13, 15 March 2022
Sumber:https://orange.biolab.si/workflows/
Untuk masalah yang supervised, di mana instance data dijelaskan dengan class label, kita ingin tahu feature mana yang paling informatif. Widget Rank menyediakan tabel fitur dan skor informativitasnya, dan mendukung pemilihan fitur manual. Dalam workflow, kita menggunakannya untuk menemukan dua fitur terbaik (dari 79 awal dari dataset yang dipilih) dan menampilkan di widget Scatter Plot.
Source
Referensi
- YOUTUBE: https://www.youtube.com/watch?v=p5XLWmSUxTQ
- YOUTUBE: https://www.youtube.com/watch?v=Fw5SztV5p3E
- https://orange.biolab.si/workflows/
