Difference between revisions of "Orange: t-SNE"
Onnowpurbo (talk | contribs) (→Contoh) |
Onnowpurbo (talk | contribs) (→Output) |
||
| (4 intermediate revisions by the same user not shown) | |||
| Line 1: | Line 1: | ||
Sumber: https://docs.biolab.si//3/visual-programming/widgets/unsupervised/tsne.html | Sumber: https://docs.biolab.si//3/visual-programming/widgets/unsupervised/tsne.html | ||
| − | + | Widget t-SNE melakukan projeksi 2-dimensi menggunakan t-SNE. | |
==Input== | ==Input== | ||
| Line 13: | Line 13: | ||
Data: data with an additional column showing whether a point is selected | Data: data with an additional column showing whether a point is selected | ||
| − | Widget t-SNE memplot data dengan metode t-distributed stochastic neighbor embedding. t-SNE | + | Widget t-SNE memplot data dengan metode t-distributed stochastic neighbor embedding. Widget t-SNE menggunakan teknik reduksi dimensi, mirip dengan widget MDS, di mana titik dipetakan ke ruang 2-D oleh distribusi probabilitas mereka. |
| − | [[File:TSNE-stamped.png|center| | + | [[File:TSNE-stamped.png|center|600px|thumb]] |
* Number of iterations for optimization and the measure of perplexity. Press Start to (re-)run the optimization. | * Number of iterations for optimization and the measure of perplexity. Press Start to (re-)run the optimization. | ||
| Line 33: | Line 33: | ||
Kita menggunakan Widget Single Cell Datasets untuk me-load Bone marrow mononuclear cells dengan AML (sample) data. Kemudian kita mengirimkannya melalui Widget k-Means dan memilih 2 cluster dari Silhouette Scores. OK tampaknya akan ada dua cluster yang berbeda disini. | Kita menggunakan Widget Single Cell Datasets untuk me-load Bone marrow mononuclear cells dengan AML (sample) data. Kemudian kita mengirimkannya melalui Widget k-Means dan memilih 2 cluster dari Silhouette Scores. OK tampaknya akan ada dua cluster yang berbeda disini. | ||
| − | + | Pertanyaannya - dapat kita menemukan sub-population di cell ini? Coba kita load Bone marrow mononuclear cells dengan AML (markers) dengan Widget Single Cell Datasets. Sekarang kirimkan marker genes ke widget Data Table dan pilih, sebagai natural killer cells dari daftar (NKG7). | |
| − | Kirimkan marker dan hasil k-Means ke widget Score Cells dan pilih geneName untuk mencocokan marker dengan gene. Akhirnya, tambahkan t-SNE untuk mem-visualisasi hasilnya. | + | Kirimkan marker dan hasil k-Means ke widget Score Cells dan pilih geneName untuk mencocokan marker dengan gene. Akhirnya, tambahkan widget t-SNE untuk mem-visualisasi hasilnya. |
| − | Di t-SNE, gunakan atribut Scores untuk memberikan warna (color) dari titik (point) dan set size (ukuran) titik tersebut. Kita akan melihat bahwa killer cell akan berkumpul menjadi sebuah cluster tersendiri dan ternyata t-SNE dapat menemukan subpopulasi-nya. | + | Di widget t-SNE, gunakan atribut Scores untuk memberikan warna (color) dari titik (point) dan set size (ukuran) titik tersebut. Kita akan melihat bahwa killer cell akan berkumpul menjadi sebuah cluster tersendiri dan ternyata widget t-SNE dapat menemukan subpopulasi-nya. |
| − | [[File:TSNE-Example.png|center| | + | [[File:TSNE-Example.png|center|600px|thumb]] |
==Referensi== | ==Referensi== | ||
Latest revision as of 08:58, 15 April 2020
Sumber: https://docs.biolab.si//3/visual-programming/widgets/unsupervised/tsne.html
Widget t-SNE melakukan projeksi 2-dimensi menggunakan t-SNE.
Input
Data: input dataset
Data Subset: subset of instances
Output
Selected Data: instances selected from the plot
Data: data with an additional column showing whether a point is selected
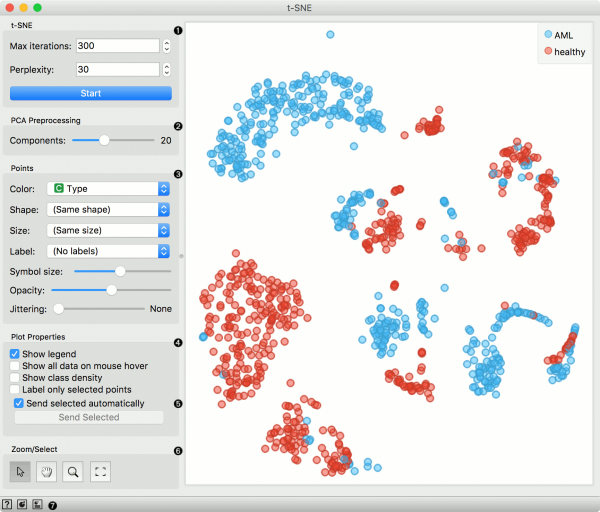
Widget t-SNE memplot data dengan metode t-distributed stochastic neighbor embedding. Widget t-SNE menggunakan teknik reduksi dimensi, mirip dengan widget MDS, di mana titik dipetakan ke ruang 2-D oleh distribusi probabilitas mereka.
- Number of iterations for optimization and the measure of perplexity. Press Start to (re-)run the optimization.
- Select the number of PCA components used for projection.
- Set the color of the displayed points (you will get colors for discrete values and grey-scale points for continuous). Set shape, size and label to differentiate between points. Set symbol size and opacity for all data points. Set jittering to randomly disperse data points.
- Adjust plot properties:
- Show legend displays a legend on the right. Click and drag the legend to move it.
- Show all data on mouse hover enables information bubbles if the cursor is placed on a dot.
- Show class density colors the graph by class.
- Label only selected points allows you to select individual data instances and label them.
- If Send selected automatically is ticked, changes are communicated automatically. Alternatively, press Send Selected.
- Select, zoom, pan and zoom to fit are the options for exploring the graph. The manual selection of data instances works as an angular/square selection tool. Double click to move the projection. Scroll in or out for zoom.
- Access help, save image or produce a report.
Contoh
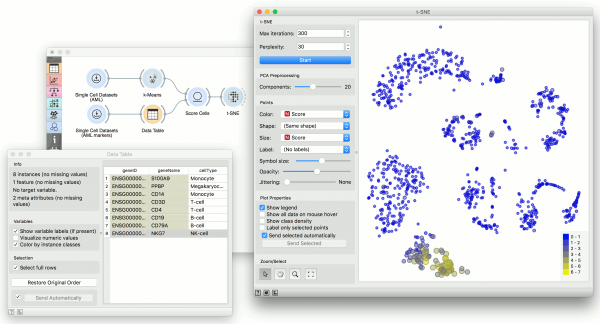
Kita menggunakan Widget Single Cell Datasets untuk me-load Bone marrow mononuclear cells dengan AML (sample) data. Kemudian kita mengirimkannya melalui Widget k-Means dan memilih 2 cluster dari Silhouette Scores. OK tampaknya akan ada dua cluster yang berbeda disini.
Pertanyaannya - dapat kita menemukan sub-population di cell ini? Coba kita load Bone marrow mononuclear cells dengan AML (markers) dengan Widget Single Cell Datasets. Sekarang kirimkan marker genes ke widget Data Table dan pilih, sebagai natural killer cells dari daftar (NKG7).
Kirimkan marker dan hasil k-Means ke widget Score Cells dan pilih geneName untuk mencocokan marker dengan gene. Akhirnya, tambahkan widget t-SNE untuk mem-visualisasi hasilnya.
Di widget t-SNE, gunakan atribut Scores untuk memberikan warna (color) dari titik (point) dan set size (ukuran) titik tersebut. Kita akan melihat bahwa killer cell akan berkumpul menjadi sebuah cluster tersendiri dan ternyata widget t-SNE dapat menemukan subpopulasi-nya.

