Difference between revisions of "Orange: Silhouette Plot"
Onnowpurbo (talk | contribs) |
Onnowpurbo (talk | contribs) |
||
| (3 intermediate revisions by the same user not shown) | |||
| Line 2: | Line 2: | ||
| − | + | Widget Silhouette Plot menampilkan representasi grafis akan inkonsistensi dalam data cluster. | |
| − | |||
| − | + | ==Input== | |
| − | + | Data: input dataset | |
| − | + | ==Output== | |
| − | |||
| − | + | Selected Data: instances selected from the plot | |
| + | Data: data with an additional column showing whether a point is selected | ||
| − | + | Widget Silhouette Plot menawarkan representasi grafis akan konsistensi dalam data cluster dan memberi pengguna sarana untuk menilai kualitas cluster secara visual. Silhouette score adalah ukuran seberapa mirip suatu objek dengan clusternya sendiri dibandingkan dengan cluster lain dan sangat penting dalam pembuatan Silhouette plot. Silhouette score mendekati 1 menunjukkan bahwa instance data dekat dengan pusat cluster dan instance yang memiliki Silhouette score mendekati 0 berada di perbatasan antara dua cluster. | |
| − | + | [[File:SilhouettePlot-stamped.png|center|600px|thumb]] | |
| − | |||
| − | |||
| − | |||
| − | |||
| − | + | * Choose the distance metric. You can choose between: | |
| − | + | ** Euclidean (“straight line” distance between two points) | |
| − | + | ** Manhattan (the sum of absolute differences for all attributes) | |
| − | + | ** Cosine (1 - cosine of the angle between two vectors) | |
| − | + | * Select the cluster label. You can decide whether to group the instances by cluster or not. | |
| + | * Display options: | ||
| − | + | ** Choose bar width. | |
| + | ** Annotations: annotate the silhouette plot. | ||
| − | + | * Save Image saves the created silhouette plot to your computer in a .png or .svg format. | |
| − | + | * Produce a report. | |
| − | |||
| − | + | * Output: | |
| − | + | ** Add silhouette scores (good clusters have higher silhouette scores) | |
| − | + | ** By clicking Commit, changes are communicated to the output of the widget. Alternatively, tick the box on the left and changes will be communicated automatically. | |
| − | + | ** The created silhouette plot. | |
| − | |||
| − | |||
| + | ==Contoh== | ||
| + | Dalam workflow di bawah ini, kita akan menggunakan widget Silhouette Plot pada dataset iris. Kita memilih instance data dengan silhouette score rendah dan meneruskannya subset dari widget Scatter Plot. Visualisasi ini hanya mengkonfirmasi keakuratan widget Silhouette Plot, karena anda dapat dengan jelas melihat bahwa subset terletak di perbatasan antara dua cluster. | ||
| + | [[File:SilhouettePlot-Example.png|center|600px|thumb]] | ||
==Referensi== | ==Referensi== | ||
Latest revision as of 11:13, 9 April 2020
Sumber: https://docs.biolab.si//3/visual-programming/widgets/visualize/silhouetteplot.html
Widget Silhouette Plot menampilkan representasi grafis akan inkonsistensi dalam data cluster.
Input
Data: input dataset
Output
Selected Data: instances selected from the plot
Data: data with an additional column showing whether a point is selected
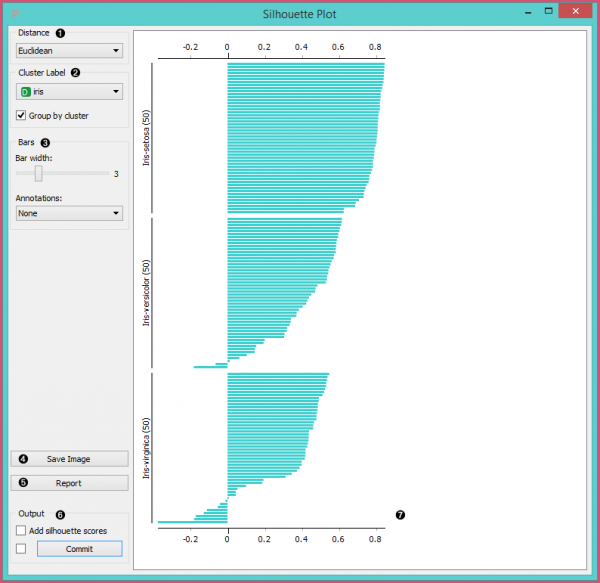
Widget Silhouette Plot menawarkan representasi grafis akan konsistensi dalam data cluster dan memberi pengguna sarana untuk menilai kualitas cluster secara visual. Silhouette score adalah ukuran seberapa mirip suatu objek dengan clusternya sendiri dibandingkan dengan cluster lain dan sangat penting dalam pembuatan Silhouette plot. Silhouette score mendekati 1 menunjukkan bahwa instance data dekat dengan pusat cluster dan instance yang memiliki Silhouette score mendekati 0 berada di perbatasan antara dua cluster.
- Choose the distance metric. You can choose between:
- Euclidean (“straight line” distance between two points)
- Manhattan (the sum of absolute differences for all attributes)
- Cosine (1 - cosine of the angle between two vectors)
- Select the cluster label. You can decide whether to group the instances by cluster or not.
- Display options:
- Choose bar width.
- Annotations: annotate the silhouette plot.
- Save Image saves the created silhouette plot to your computer in a .png or .svg format.
- Produce a report.
- Output:
- Add silhouette scores (good clusters have higher silhouette scores)
- By clicking Commit, changes are communicated to the output of the widget. Alternatively, tick the box on the left and changes will be communicated automatically.
- The created silhouette plot.
Contoh
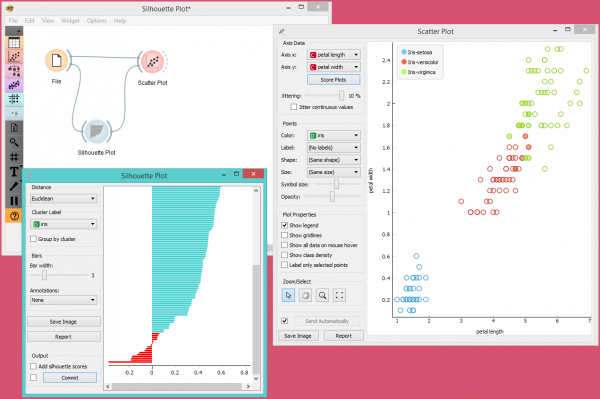
Dalam workflow di bawah ini, kita akan menggunakan widget Silhouette Plot pada dataset iris. Kita memilih instance data dengan silhouette score rendah dan meneruskannya subset dari widget Scatter Plot. Visualisasi ini hanya mengkonfirmasi keakuratan widget Silhouette Plot, karena anda dapat dengan jelas melihat bahwa subset terletak di perbatasan antara dua cluster.

