Difference between revisions of "Orange: Linear Projection"
Onnowpurbo (talk | contribs) |
Onnowpurbo (talk | contribs) |
||
| (8 intermediate revisions by the same user not shown) | |||
| Line 2: | Line 2: | ||
| − | + | Widget Linear Projection melakukan proyeksi linier dengan analisis data eksploratif. | |
==Input== | ==Input== | ||
| Line 16: | Line 16: | ||
Components: projection vectors | Components: projection vectors | ||
| − | + | Widget Linear Projection menampilkan proyeksi linear class-labeled data. Ini mendukung berbagai jenis proyeksi seperti circular, linear discriminant analysis, principal component analysis, dan custom projection. | |
| − | + | Untuk memberikan gambaran Widget Linear Projection, kita lihat proyeksi dataset Iris di bawah ini. Terlihat bahwa lebar sepal dan panjang sepal yang sudah memisahkan Iris setosa dari dua lainnya, sedangkan panjang petal adalah atribut terbaik memisahkan Iris versicolor dari Iris virginica. | |
| − | [[File:Linear-projection-stamped.png|center| | + | [[File:Linear-projection-stamped.png|center|600px|thumb]] |
* Axes in the projection that are displayed and other available axes. | * Axes in the projection that are displayed and other available axes. | ||
| Line 39: | Line 39: | ||
==Contoh== | ==Contoh== | ||
| − | + | Widget Linear Projection berfungsi seperti widget visualisasi lainnya. Di bawah ini, kita menghubungkannya ke widget File untuk melihat dataset diproyeksikan pada bidang 2-D. Kemudian kita memilih data untuk analisis lebih lanjut dan menghubungkannya ke widget Data Table untuk melihat detail dari subset yang dipilih. | |
| − | [[File:LinearProjection-example.png|center| | + | [[File:LinearProjection-example.png|center|600px|thumb]] |
| + | |||
| + | ==Youtube== | ||
| + | |||
| + | * [https://youtu.be/a1-rDTYzY6c YOUTUBE: Orange Linear Projection] | ||
| Line 49: | Line 53: | ||
Boulesteix A.-L., Strimmer K. (2006). Partial least squares: a versatile tool for the analysis of high-dimensional genomic data. Briefings in Bioinformatics, 8(1), 32-44. Abstract here. | Boulesteix A.-L., Strimmer K. (2006). Partial least squares: a versatile tool for the analysis of high-dimensional genomic data. Briefings in Bioinformatics, 8(1), 32-44. Abstract here. | ||
| − | |||
| − | |||
| − | |||
| − | |||
==Referensi== | ==Referensi== | ||
Latest revision as of 04:43, 9 April 2020
Sumber: https://docs.biolab.si//3/visual-programming/widgets/visualize/linearprojection.html
Widget Linear Projection melakukan proyeksi linier dengan analisis data eksploratif.
Input
Data: input dataset
Data Subset: subset of instances
Projection: custom projection vectors
Output
Selected Data: instances selected from the plot
Data: data with an additional column showing whether a point is selected
Components: projection vectors
Widget Linear Projection menampilkan proyeksi linear class-labeled data. Ini mendukung berbagai jenis proyeksi seperti circular, linear discriminant analysis, principal component analysis, dan custom projection.
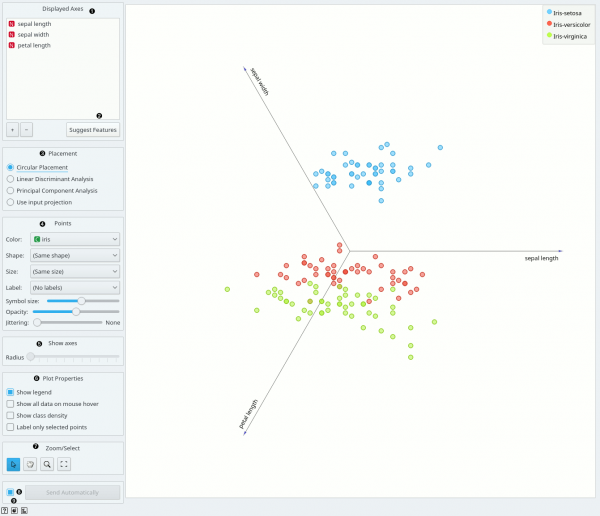
Untuk memberikan gambaran Widget Linear Projection, kita lihat proyeksi dataset Iris di bawah ini. Terlihat bahwa lebar sepal dan panjang sepal yang sudah memisahkan Iris setosa dari dua lainnya, sedangkan panjang petal adalah atribut terbaik memisahkan Iris versicolor dari Iris virginica.
- Axes in the projection that are displayed and other available axes.
- Optimize your projection by using Suggest Features. This feature scores attributes by average classification accuracy and returns the top scoring attributes with a simultaneous visualization update.
- Choose the type of projection.
- Axes inside a circle are hidden. Circle radius can be be changed using a slider.
- Adjust plot properties:
- Set jittering to prevent the dots from overlapping (especially for discrete attributes).
- Show legend displays a legend on the right. Click and drag the legend to move it.
- Show class density colors the graph by class (see the screenshot below).
- Label only selected points allows you to select individual data instances and label them.
- Select, zoom, pan and zoom to fit are the options for exploring the graph. Manual selection of data instances works as an angular/square selection tool. Double click to move the projection. Scroll in or out for zoom.
- If Send automatically is ticked, changes are communicated automatically. Alternatively, press Send.
- Save Image saves the created image to your computer in a .svg or .png format. Produce a report.
Contoh
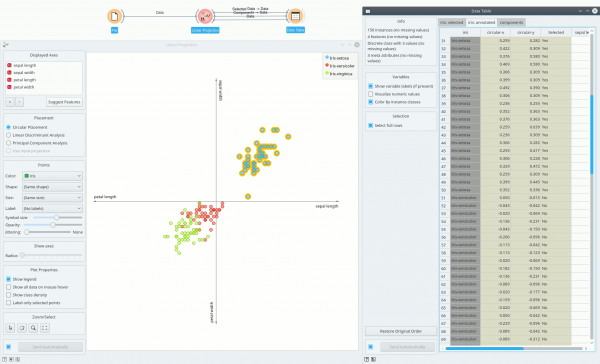
Widget Linear Projection berfungsi seperti widget visualisasi lainnya. Di bawah ini, kita menghubungkannya ke widget File untuk melihat dataset diproyeksikan pada bidang 2-D. Kemudian kita memilih data untuk analisis lebih lanjut dan menghubungkannya ke widget Data Table untuk melihat detail dari subset yang dipilih.
Youtube
Referensi
Koren Y., Carmel L. (2003). Visualization of labeled data using linear transformations. In Proceedings of IEEE Information Visualization 2003, (InfoVis’03). Available here.
Boulesteix A.-L., Strimmer K. (2006). Partial least squares: a versatile tool for the analysis of high-dimensional genomic data. Briefings in Bioinformatics, 8(1), 32-44. Abstract here.

