Difference between revisions of "Orange: Data Table"
Onnowpurbo (talk | contribs) |
Onnowpurbo (talk | contribs) (→Contoh) |
||
| (9 intermediate revisions by the same user not shown) | |||
| Line 3: | Line 3: | ||
| − | + | Widget Data Table dapat menayangkan attribute-value data dalam sebuah spreadsheet. | |
| − | + | ==Input== | |
| − | + | Data: input dataset | |
| − | + | ==Output== | |
| − | + | Selected Data: instance terpilih dari tabel | |
| − | + | Widget Data Table menerima satu atau beberapa dataset melalui inputnya dan menyajikannya sebagai spreadsheet. Instance data dapat diurutkan berdasarkan nilai atribut. Widget ini juga mendukung pemilihan instance data secara manual. | |
| − | + | [[File:DataTable-stamped.png|center|600px|thumb]] | |
| − | |||
| − | + | # The name of the dataset (usually the input data file). Data instances are in rows and their attribute values in columns. In this example, the dataset is sorted by the attribute “sepal length”. | |
| + | # Info on current dataset size and number and types of attributes | ||
| + | # Values of continuous attributes can be visualized with bars; colors can be attributed to different classes. | ||
| + | # Data instances (rows) can be selected and sent to the widget’s output channel. | ||
| + | # Use the Restore Original Order button to reorder data instances after attribute-based sorting. | ||
| + | # Produce a report. | ||
| + | # While auto-send is on, all changes will be automatically communicated to other widgets. Otherwise, press Send Selected Rows. | ||
| − | + | ==Contoh== | |
| − | + | Dalam workflow di bawah ini, kita menggunakan dua widget File untuk membaca dataset Iris dan Glass (disediakan dalam distribusi Orange), dan mengirimkannya ke widget Data Table. | |
| − | |||
| − | |||
| − | |||
| − | |||
| − | |||
| − | |||
| − | |||
| − | |||
| − | |||
| − | |||
| − | |||
| − | |||
| − | |||
| − | |||
| − | |||
| + | [[File:DataTable-Schema.png.jpeg|center|600px|thumb]] | ||
| + | Contoh data yang dipilih dalam Widget Data Table pertama diteruskan ke Widget Data Table kedua. Perhatikan bahwa kita dapat memilih dataset mana yang akan dilihat (iris atau glass). Mengubah dari satu dataset ke yang lain mengubah pemilihan instance data yang dikomunikasikan jika Commit on any change dipilih. | ||
| + | [[File:DataTable-Example.png|center|600px|thumb]] | ||
==Referensi== | ==Referensi== | ||
Latest revision as of 09:23, 20 March 2020
Sumber: https://docs.biolab.si//3/visual-programming/widgets/data/datatable.html
Widget Data Table dapat menayangkan attribute-value data dalam sebuah spreadsheet.
Input
Data: input dataset
Output
Selected Data: instance terpilih dari tabel
Widget Data Table menerima satu atau beberapa dataset melalui inputnya dan menyajikannya sebagai spreadsheet. Instance data dapat diurutkan berdasarkan nilai atribut. Widget ini juga mendukung pemilihan instance data secara manual.
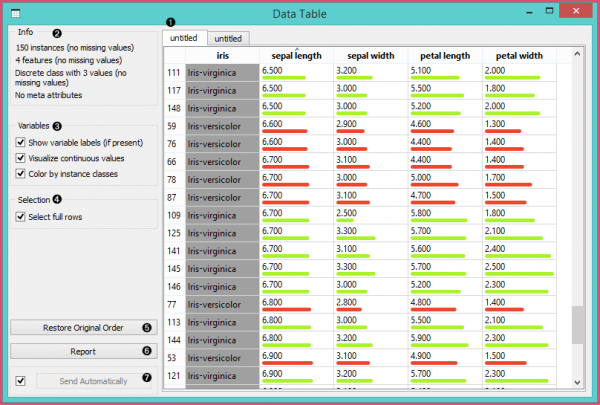
- The name of the dataset (usually the input data file). Data instances are in rows and their attribute values in columns. In this example, the dataset is sorted by the attribute “sepal length”.
- Info on current dataset size and number and types of attributes
- Values of continuous attributes can be visualized with bars; colors can be attributed to different classes.
- Data instances (rows) can be selected and sent to the widget’s output channel.
- Use the Restore Original Order button to reorder data instances after attribute-based sorting.
- Produce a report.
- While auto-send is on, all changes will be automatically communicated to other widgets. Otherwise, press Send Selected Rows.
Contoh
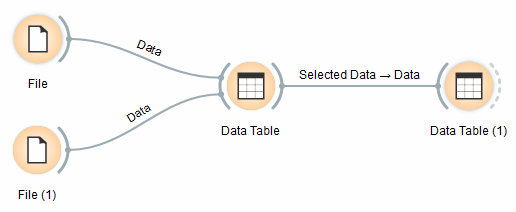
Dalam workflow di bawah ini, kita menggunakan dua widget File untuk membaca dataset Iris dan Glass (disediakan dalam distribusi Orange), dan mengirimkannya ke widget Data Table.
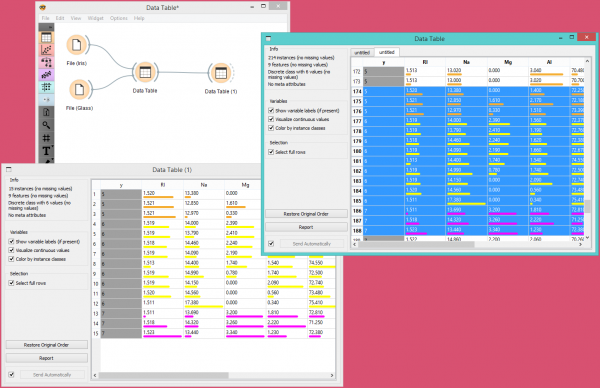
Contoh data yang dipilih dalam Widget Data Table pertama diteruskan ke Widget Data Table kedua. Perhatikan bahwa kita dapat memilih dataset mana yang akan dilihat (iris atau glass). Mengubah dari satu dataset ke yang lain mengubah pemilihan instance data yang dikomunikasikan jika Commit on any change dipilih.


