Difference between revisions of "Orange: Line Plot"
Onnowpurbo (talk | contribs) |
Onnowpurbo (talk | contribs) |
||
| (4 intermediate revisions by the same user not shown) | |||
| Line 1: | Line 1: | ||
Sumber: https://docs.biolab.si//3/visual-programming/widgets/visualize/lineplot.html | Sumber: https://docs.biolab.si//3/visual-programming/widgets/visualize/lineplot.html | ||
| − | + | Widget Line Plot dapat digunakan untuk memvisualisasi profil data (misalnya, Deret waktu / time series). | |
| − | + | ==Input== | |
| − | + | Data: input dataset | |
| − | + | Data Subset: subset of instances | |
| − | + | ==Output== | |
| − | + | Selected Data: instances selected from the plot | |
| − | + | Data: data with an additional column showing whether a point is selected | |
| − | Line plot | + | Line plot, jenis plot yang menampilkan data sebagai serangkaian titik, dihubungkan oleh segmen garis lurus. Line Plot berfungsi untuk data numerik. Sementara untuk data kategorikal, Line Plot dapat digunakan untuk pengelompokan titik / poin data. |
[[File:LinePlot-stamped.png|center|200px|thumb]] | [[File:LinePlot-stamped.png|center|200px|thumb]] | ||
| − | + | * Information on the input data. | |
| + | * Select what you wish to display: | ||
| − | + | ** Lines show individual data instances in a plot. | |
| + | ** Range shows the range of data points between 10th and 90th percentile. | ||
| + | ** Mean adds the line for mean value. If group by is selected, means will be displayed per each group value. | ||
| + | ** Error bars show the standard deviation of each attribute. | ||
| − | + | * Select a categorical attribute to use for grouping of data instances. Use None to show ungrouped data. | |
| − | + | * Select, zoom, pan and zoom to fit are the options for exploring the graph. The manual selection of data instances works as a line selection, meaning the data under the selected line plots will be sent on the output. Scroll in or out for zoom. | |
| − | + | * If Send Automatically is ticked, changes are communicated automatically. Alternatively, click Send. | |
| − | |||
| − | |||
| − | |||
| − | |||
| − | |||
| − | |||
| − | |||
==Contoh== | ==Contoh== | ||
| − | Line Plot | + | Widget Line Plot adalah widget visualisasi standar, yang menampilkan profil data, biasanya berupa data numerik yang diurutkan. Dalam contoh sederhana ini, kita akan menampilkan data iris dalam plot garis, dikelompokkan berdasarkan atribut iris. Plot menunjukkan bagaimana panjang petal memisahkan nilai class dengan baik. |
| − | + | Jika kita amati ini dalam Widget Scatter Plot, kita dapat memastikan ini memang benar. Panjang petal adalah atribut yang menarik untuk pemisahan class, terutama ketika ditingkatkan dengan lebar petal, yang juga dipisahkan dengan baik dalam line plot. | |
[[File:LinePlot-Example.png|center|200px|thumb]] | [[File:LinePlot-Example.png|center|200px|thumb]] | ||
| − | |||
==Referensi== | ==Referensi== | ||
Latest revision as of 06:54, 18 March 2020
Sumber: https://docs.biolab.si//3/visual-programming/widgets/visualize/lineplot.html
Widget Line Plot dapat digunakan untuk memvisualisasi profil data (misalnya, Deret waktu / time series).
Input
Data: input dataset
Data Subset: subset of instances
Output
Selected Data: instances selected from the plot
Data: data with an additional column showing whether a point is selected
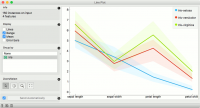
Line plot, jenis plot yang menampilkan data sebagai serangkaian titik, dihubungkan oleh segmen garis lurus. Line Plot berfungsi untuk data numerik. Sementara untuk data kategorikal, Line Plot dapat digunakan untuk pengelompokan titik / poin data.
- Information on the input data.
- Select what you wish to display:
- Lines show individual data instances in a plot.
- Range shows the range of data points between 10th and 90th percentile.
- Mean adds the line for mean value. If group by is selected, means will be displayed per each group value.
- Error bars show the standard deviation of each attribute.
- Select a categorical attribute to use for grouping of data instances. Use None to show ungrouped data.
- Select, zoom, pan and zoom to fit are the options for exploring the graph. The manual selection of data instances works as a line selection, meaning the data under the selected line plots will be sent on the output. Scroll in or out for zoom.
- If Send Automatically is ticked, changes are communicated automatically. Alternatively, click Send.
Contoh
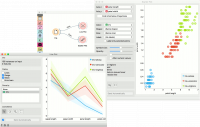
Widget Line Plot adalah widget visualisasi standar, yang menampilkan profil data, biasanya berupa data numerik yang diurutkan. Dalam contoh sederhana ini, kita akan menampilkan data iris dalam plot garis, dikelompokkan berdasarkan atribut iris. Plot menunjukkan bagaimana panjang petal memisahkan nilai class dengan baik.
Jika kita amati ini dalam Widget Scatter Plot, kita dapat memastikan ini memang benar. Panjang petal adalah atribut yang menarik untuk pemisahan class, terutama ketika ditingkatkan dengan lebar petal, yang juga dipisahkan dengan baik dalam line plot.

