Difference between revisions of "Orange: Correlogram"
Jump to navigation
Jump to search
Onnowpurbo (talk | contribs) |
Onnowpurbo (talk | contribs) |
||
| (2 intermediate revisions by the same user not shown) | |||
| Line 1: | Line 1: | ||
Sumber: https://orange.biolab.si/widget-catalog/time-series/correlogram/ | Sumber: https://orange.biolab.si/widget-catalog/time-series/correlogram/ | ||
| − | |||
| − | + | Widget Correlogram dapat memvisualisasi auto-correlation pada variable. | |
| + | |||
| + | ==Input== | ||
Time series: Time series as output by As Timeseries widget. | Time series: Time series as output by As Timeseries widget. | ||
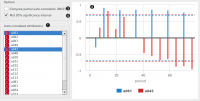
| − | + | Pada widget Correlogram, kita akan mem-visualisasi koefisien autocorrelation untuk time series yang kita pilih. | |
[[File:Correlogram-stamped.png|center|200px|thumb]] | [[File:Correlogram-stamped.png|center|200px|thumb]] | ||
| − | + | * Select the series to calculate autocorrelation for. | |
| − | + | * See the autocorrelation coefficients. | |
| − | + | * Choose to calculate the coefficients using partial autocorrelation function (PACF) instead. | |
| − | + | * Choose to plot the 95% significance interval (dotted horizontal line). Coefficients that are outside of this interval might be significant. | |
==See also== | ==See also== | ||
Latest revision as of 11:32, 17 March 2020
Sumber: https://orange.biolab.si/widget-catalog/time-series/correlogram/
Widget Correlogram dapat memvisualisasi auto-correlation pada variable.
Input
Time series: Time series as output by As Timeseries widget.
Pada widget Correlogram, kita akan mem-visualisasi koefisien autocorrelation untuk time series yang kita pilih.
- Select the series to calculate autocorrelation for.
- See the autocorrelation coefficients.
- Choose to calculate the coefficients using partial autocorrelation function (PACF) instead.
- Choose to plot the 95% significance interval (dotted horizontal line). Coefficients that are outside of this interval might be significant.
See also
Periodogram
