Difference between revisions of "Orange: Network Analysis"
Onnowpurbo (talk | contribs) |
Onnowpurbo (talk | contribs) (→Contoh) |
||
| (5 intermediate revisions by the same user not shown) | |||
| Line 2: | Line 2: | ||
| − | Statistical analysis | + | Statistical analysis dari network data. |
==Input== | ==Input== | ||
| Line 14: | Line 14: | ||
Items: New properties of a network file. | Items: New properties of a network file. | ||
| − | Network Analysis | + | Widget Network Analysis menghitung rangkuman statistik dari node-level dan graph-level untuk network. Widget Network Analysis akan mengeluarkan network dengan hasil komputasi statistik-nya dan sebuah extended item data table (hanya node-level index). |
==Graph level== | ==Graph level== | ||
| Line 43: | Line 43: | ||
* Closeness centrality: distance to all other nodes. | * Closeness centrality: distance to all other nodes. | ||
| − | == | + | ==Contoh== |
| − | + | Contoh workflow ini menunjukkan bagaimana Network Analysis dapat memperkaya workflow. Kita telah menggunakan data lastfm.net sebagai input network dari Widget Network File dan mengirimkannya ke Widget Network Analysis. Kita dapat memutuskan untuk menghitung derajat, derajat sentralitas, dan sentralitas kedekatan pada node-level. | |
| − | + | Kita kemudian dapat memvisualisasikan network di Widget Network Explorer. Di widget Network Explorer memberi warna dengan tag terbaik, seperti default untuk dataset ini. Tapi sekarang kita juga dapat mengatur ukuran node agar sesuai dengan sentralitas derajat hasil perhitungan. Ini adalah cara yang baik untuk memvisualisasikan properti network. | |
[[File:Network-analysis-example.png|center|200px|thumb]] | [[File:Network-analysis-example.png|center|200px|thumb]] | ||
| − | |||
| − | |||
==Referensi== | ==Referensi== | ||
Latest revision as of 09:03, 12 March 2020
Sumber: https://orange.biolab.si/widget-catalog/networks/networkanalysis/
Statistical analysis dari network data.
Input
Network: An instance of Network Graph.
Items: Properties of a network file.
Output
Network: An instance of Network Graph with appended information.
Items: New properties of a network file.
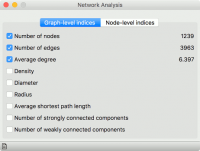
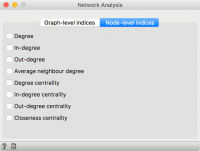
Widget Network Analysis menghitung rangkuman statistik dari node-level dan graph-level untuk network. Widget Network Analysis akan mengeluarkan network dengan hasil komputasi statistik-nya dan sebuah extended item data table (hanya node-level index).
Graph level
- Number of nodes: number of vertices in a network.
- Number of edges: number of connections in a network.
- Average degree: average number of connections per node.
- Density: ratio between actual number of edges and maximum number of edges (fully connected graph).
- Diameter: maximum eccentricity of the graph.
- Radius: minimum eccentricity of the graph.
- Average shortest path length: expected distance between two nodes in the graph.
- Number of strongly connected components: parts of network where every vertex is reachable from every other vertex (for directed graphs only).
- Number of weakly connected components: parts of network where replacing all of its directed edges with undirected edges produces a connected (undirected) graph (for directed graphs only).
Node level
- Degree: number of edges per node.
- In-degree: number of incoming edges in a directed graph.
- Out-degree: number of outgoing edges in a directed graph.
- Average neighbor degree: average degree of neighboring nodes.
- Degree centrality: ratio of other nodes connected to the node.
- In-degree centrality: ratio of incoming edges to a node in a directed graph.
- Out-degree centrality: ratio of outgoing edges from a node in directed graph.
- Closeness centrality: distance to all other nodes.
Contoh
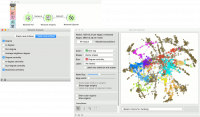
Contoh workflow ini menunjukkan bagaimana Network Analysis dapat memperkaya workflow. Kita telah menggunakan data lastfm.net sebagai input network dari Widget Network File dan mengirimkannya ke Widget Network Analysis. Kita dapat memutuskan untuk menghitung derajat, derajat sentralitas, dan sentralitas kedekatan pada node-level.
Kita kemudian dapat memvisualisasikan network di Widget Network Explorer. Di widget Network Explorer memberi warna dengan tag terbaik, seperti default untuk dataset ini. Tapi sekarang kita juga dapat mengatur ukuran node agar sesuai dengan sentralitas derajat hasil perhitungan. Ini adalah cara yang baik untuk memvisualisasikan properti network.


