Difference between revisions of "Orange: Heat Map"
Onnowpurbo (talk | contribs) (Created page with "Sumber: https://docs.biolab.si//3/visual-programming/widgets/visualize/heatmap.html Plots a heat map for a pair of attributes. Inputs Data: input dataset Outputs...") |
Onnowpurbo (talk | contribs) (→Output) |
||
| (5 intermediate revisions by the same user not shown) | |||
| Line 2: | Line 2: | ||
| − | + | Plot heat map untuk sepasang atribut. | |
| − | + | ==Input== | |
| − | + | Data: input dataset | |
| − | + | ==Output== | |
| − | + | Selected Data: instances selected from the plot | |
| − | Heat map | + | Heat map adalah metode grafis untuk memvisualisasikan nilai atribut berdasarkan class dalam two-way matrix. Heat map hanya dapat digunakan pada dataset yang berisi variabel kontinu. Nilai-nilai diwakili oleh warna: semakin tinggi nilai tertentu, semakin gelap warna yang diwakili. Dengan menggabungkan class dan atribut pada sumbu x dan y, kita melihat di mana nilai atribut yang terkuat dan terlemah, sehingga memungkinkan kita untuk menemukan feature typical (diskrit) atau rentang nilai (kontinu) untuk setiap class. |
| − | + | [[File:HeatMap-stamped.png|center|200px|thumb]] | |
| − | + | * The color scheme legend. Low and High are thresholds for the color palette (low for attributes with low values and high for attributes with high values). | |
| + | * Merge data. | ||
| + | * Sort columns and rows: | ||
| + | ** No Sorting (lists attributes as found in the dataset) | ||
| + | ** Clustering (clusters data by similarity) | ||
| + | ** Clustering with ordered leaves (maximizes the sum of similarities of adjacent elements) | ||
| + | * Set what is displayed in the plot in Annotation & Legend. | ||
| + | ** If Show legend is ticked, a color chart will be displayed above the map. | ||
| + | ** If Stripes with averages is ticked, a new line with attribute averages will be displayed on the left. | ||
| + | ** Row Annotations adds annotations to each instance on the right. | ||
| + | ** Column Label Positions places column labels in a selected place (None, Top, Bottom, Top and Bottom). | ||
| + | * If Keep aspect ratio is ticked, each value will be displayed with a square (proportionate to the map). | ||
| + | * If Send Automatically is ticked, changes are communicated automatically. Alternatively, click Send. | ||
| + | * Save image saves the image to your computer in a .svg or .png format. | ||
| + | * Produce a report. | ||
| − | + | ==Contoh== | |
| − | + | Heat Map di bawah ini menampilkan nilai atribut untuk dataset Housing. Dataset yang disebutkan di atas menyangkut nilai rumah di pinggiran kota Boston. | |
| − | + | Hal pertama yang kita lihat di peta adalah atribut ‘B’ dan ‘Pajak’, yang merupakan dua warna oranye gelap. Atribut ‘B’ memberikan informasi tentang proporsi orang kulit hitam menurut kota dan atribut ‘Pajak’ memberi tahu kita tentang full-value property-tax rate per $10.000. Untuk mendapatkan heat map yang lebih jelas, kami kemudian menggunakan Select Columns widget dan menghapus dua atribut dari dataset. Kemudian kita kembali mengumpankan data ke heat map. Proyeksi baru ini menawarkan informasi tambahan. | |
| − | + | Dengan menghapus ‘B’ dan ‘Pajak’, kita dapat melihat faktor penentu lainnya, yaitu 'Age’ dan ‘ZN ’. Atribut ‘Age’ memberikan informasi tentang proporsi unit yang ditempati pemilik yang dibangun sebelum 1940 dan atribut ‘ZN’ memberi tahu kita tentang proporsi non-retail business acres per town. | |
| − | + | [[File:HeatMap-Example1.png|center|200px|thumb]] | |
| − | |||
| − | + | Heat Map widget adalah alat yang bagus untuk menemukan feature yang relevan dalam data. Dengan menghapus beberapa feature yang lebih menonjol, kita menemukan informasi baru, yang bersembunyi di belakang. | |
| − | + | ==Referensi== | |
| − | + | * [https://archive.ics.uci.edu/ml/datasets.php Dataset] | |
| − | |||
| − | |||
| − | |||
| − | |||
| − | |||
| − | |||
| − | |||
| − | |||
| − | |||
| − | |||
| − | |||
| − | |||
| − | |||
| − | |||
| − | |||
| − | |||
| − | |||
| − | |||
| − | |||
| − | |||
| − | |||
| − | |||
| − | |||
| − | |||
| − | |||
Latest revision as of 11:42, 4 March 2020
Sumber: https://docs.biolab.si//3/visual-programming/widgets/visualize/heatmap.html
Plot heat map untuk sepasang atribut.
Input
Data: input dataset
Output
Selected Data: instances selected from the plot
Heat map adalah metode grafis untuk memvisualisasikan nilai atribut berdasarkan class dalam two-way matrix. Heat map hanya dapat digunakan pada dataset yang berisi variabel kontinu. Nilai-nilai diwakili oleh warna: semakin tinggi nilai tertentu, semakin gelap warna yang diwakili. Dengan menggabungkan class dan atribut pada sumbu x dan y, kita melihat di mana nilai atribut yang terkuat dan terlemah, sehingga memungkinkan kita untuk menemukan feature typical (diskrit) atau rentang nilai (kontinu) untuk setiap class.
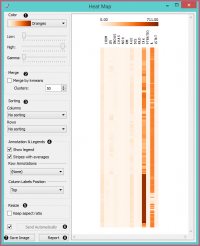
- The color scheme legend. Low and High are thresholds for the color palette (low for attributes with low values and high for attributes with high values).
- Merge data.
- Sort columns and rows:
- No Sorting (lists attributes as found in the dataset)
- Clustering (clusters data by similarity)
- Clustering with ordered leaves (maximizes the sum of similarities of adjacent elements)
- Set what is displayed in the plot in Annotation & Legend.
- If Show legend is ticked, a color chart will be displayed above the map.
- If Stripes with averages is ticked, a new line with attribute averages will be displayed on the left.
- Row Annotations adds annotations to each instance on the right.
- Column Label Positions places column labels in a selected place (None, Top, Bottom, Top and Bottom).
- If Keep aspect ratio is ticked, each value will be displayed with a square (proportionate to the map).
- If Send Automatically is ticked, changes are communicated automatically. Alternatively, click Send.
- Save image saves the image to your computer in a .svg or .png format.
- Produce a report.
Contoh
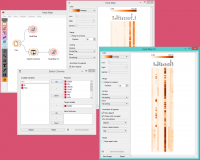
Heat Map di bawah ini menampilkan nilai atribut untuk dataset Housing. Dataset yang disebutkan di atas menyangkut nilai rumah di pinggiran kota Boston.
Hal pertama yang kita lihat di peta adalah atribut ‘B’ dan ‘Pajak’, yang merupakan dua warna oranye gelap. Atribut ‘B’ memberikan informasi tentang proporsi orang kulit hitam menurut kota dan atribut ‘Pajak’ memberi tahu kita tentang full-value property-tax rate per $10.000. Untuk mendapatkan heat map yang lebih jelas, kami kemudian menggunakan Select Columns widget dan menghapus dua atribut dari dataset. Kemudian kita kembali mengumpankan data ke heat map. Proyeksi baru ini menawarkan informasi tambahan.
Dengan menghapus ‘B’ dan ‘Pajak’, kita dapat melihat faktor penentu lainnya, yaitu 'Age’ dan ‘ZN ’. Atribut ‘Age’ memberikan informasi tentang proporsi unit yang ditempati pemilik yang dibangun sebelum 1940 dan atribut ‘ZN’ memberi tahu kita tentang proporsi non-retail business acres per town.
Heat Map widget adalah alat yang bagus untuk menemukan feature yang relevan dalam data. Dengan menghapus beberapa feature yang lebih menonjol, kita menemukan informasi baru, yang bersembunyi di belakang.
Referensi

