Difference between revisions of "Orange: Periodogram"
Jump to navigation
Jump to search
Onnowpurbo (talk | contribs) |
Onnowpurbo (talk | contribs) |
||
| Line 1: | Line 1: | ||
Sumber: https://orange.biolab.si/widget-catalog/time-series/periodogram/ | Sumber: https://orange.biolab.si/widget-catalog/time-series/periodogram/ | ||
| − | + | Mem-visualisasi cycle (siklus), seasonality, periodicity (perioda), and period-perioda yang penting di time series. | |
==Input== | ==Input== | ||
| Line 7: | Line 7: | ||
Time series: Time series as output by As Timeseries widget. | Time series: Time series as output by As Timeseries widget. | ||
| − | + | Dalam widget ini, kita akan mem-visualisaikan perioda yang paling penting pada time series. | |
[[File:Periodogram-stamped.png|center|200px|thumb]] | [[File:Periodogram-stamped.png|center|200px|thumb]] | ||
| Line 14: | Line 14: | ||
See the periods and their respective relative power spectral density estimates. | See the periods and their respective relative power spectral density estimates. | ||
| − | Periodogram | + | Periodogram untuk non-equispaced series dihitung menggunakan Lomb-Scargle method. |
==See also== | ==See also== | ||
Revision as of 11:47, 22 February 2020
Sumber: https://orange.biolab.si/widget-catalog/time-series/periodogram/
Mem-visualisasi cycle (siklus), seasonality, periodicity (perioda), and period-perioda yang penting di time series.
Input
Time series: Time series as output by As Timeseries widget.
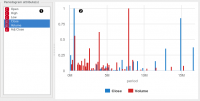
Dalam widget ini, kita akan mem-visualisaikan perioda yang paling penting pada time series.
   Select the series to calculate the periodogram for.
   See the periods and their respective relative power spectral density estimates.
Periodogram untuk non-equispaced series dihitung menggunakan Lomb-Scargle method.
See also
Correlogram
